Editable Waterfall PowerPoint And Google Slides Template

Waterfall PowerPoint chart displaying increases and decreases for eight items with color coded bars for each change.
P.ID : 49668
    411 views
    120 Downloads
    Get Custom Slides by Experts
    Instantly Access Templates in PowerPoint

    Waterfall PowerPoint Slide 


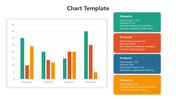
    Dive into data visualization excellence with our waterfall PPT template, meticulously crafted to transform your presentations into insightful journeys. This waterfall model PPT offers a helpful content base, ensuring that you effectively showcase financial performance, project progress, or any sequential data with precision and clarity. Unlock the power of visual storytelling as you guide your audience through the rises and falls of your data, allowing for a comprehensive understanding of the underlying trends. Our waterfall PPT template features a user-friendly design, making data interpretation seamless and accessible to both professionals and non-experts alike. Designed with your convenience in mind, these templates boast 100% editable and customizable features. Include each element to suit your specific data points, color schemes, and presentation style effortlessly. Whether you're presenting financial reports, project timelines, or performance analytics, our templates provide the perfect canvas for impactful data representation. Make your data presentations not just informative, but visually striking and memorable. Elevate your storytelling with our waterfall PowerPoint and captivate your audience with a clear, concise, and compelling narrative.

    Features of this template


    • 100% customizable slides and easy to download.
    • The slide contains 16:9 and 4:3 formats.
    • Easy to change the colors of the slide quickly.
    • Highly compatible with PowerPoint and Google Slides.
    Advertisement

    You May Also Like These PowerPoint Templates

    Add to Wishlist
    Download
    AI Customize
    Project dashboard slide with a compass design,  featuring four labeled captions, and an orange sidebar for text.
    Free
    Add to Wishlist
    Download
    AI Customize
    Chart slide with four interlinked circular diagrams, and two radar charts in blue and green at the bottom.
    Add to Wishlist
    Download
    AI Customize
    Project risk assessment executive dashboard with four columns and multiple rows, all labeled as placeholder text.
    Free
    Add to Wishlist
    Download
    AI Customize
    Pie chart with four segments in white and green on a dark patterned background, alongside a text box for description.
    Free
    Add to Wishlist
    Download
    AI Customize
    Pyramid infographic with four golden pyramids in ascending order, marked with percentages 10% to 40% on a dark base.
    Add to Wishlist
    Download
    AI Customize
    Dashboard slide featuring a stacked bar chart in red, green, and purple, and two speedometer gauge indicators below.
    Add to Wishlist
    Download
    AI Customize
    Slide featuring a financial report with bar charts and a table, showing website and a percentage statistic on the right.
    Free
    Add to Wishlist
    Download
    AI Customize
    Horizontal bar chart with green and gray bars of varying lengths, labeled with placeholder text, on a light background.
    Add to Wishlist
    Download
    AI Customize
    Four pencil-shaped bars for education in orange, blue, red, and green representing data from 2011 to 2014 with values.
    Add to Wishlist
    Download
    AI Customize
    KPI dashboard slide with metrics for Visits, Visitors, Conversion rate, and Revenue per user along with views per device.
    Free
    Add to Wishlist
    Download
    AI Customize
    Bar chart with four vertical colored columns in green, blue, yellow, and red, with gray tops and captions above.
    Add to Wishlist
    Download
    AI Customize
    Green themed chart layout featuring bar graphs, pie charts, line graphs, and a world map for diverse data visualization.
    Add to Wishlist
    Download
    AI Customize
    Bar chart in PowerPoint displaying data with titles and placeholders for example text and additional information.
    Add to Wishlist
    Download
    AI Customize
    Project comparison table with sections for team members, location, costs, and risk before and after changes.
    Add to Wishlist
    Download
    AI Customize
    Chart slide showing monthly bar graphs split into two sections and pie charts highlighting four color-coded items.
    Add to Wishlist
    Download
    AI Customize
    Executive dashboard with four blue horizontal boxes containing text and a smiling cartoon man gesturing on the right.
    Add to Wishlist
    Download
    AI Customize
    Dashboard with a multi-colored semicircular gauge divided into four sections, labeled 01 to 04, and captions on the right.
    Add to Wishlist
    Download
    AI Customize
    Timeline chart slide displaying key dates and durations from July 2018 to October 2021 with placeholder text.