Creative Project Dashboard PPT Presentation Template

Project dashboard slide with a compass design,  featuring four labeled captions, and an orange sidebar for text.
P.ID : 9012
    407 views
    14 Downloads
    Get Custom Slides by Experts
    Instantly Access Templates in PowerPoint

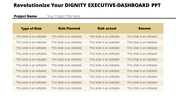
    Editable Project Dashboard PPT Template


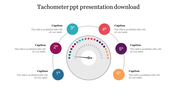
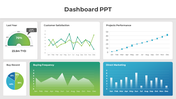
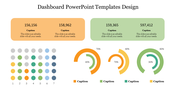
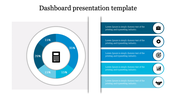
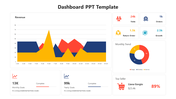
    Introducing our Dashboard PPT template, a well-designed template designed to elevate your data-driven storytelling. Whether you are a seasoned professional, an inquisitive student, or an active learner, this template is your secret weapon for creative storytelling. This slide has four separate sections, with captions that show you each in terms of your project area or metrics. The Compass Shape symbol in the middle? It’s your canvas—a customizable logo that can represent your brand, your vision, or the theme of your event. It’s like a GPS for your data—accurate, efficient, and ready to lead your audience in the right direction. Download our Templates and Google Slides Themes now.


    Features of the template:


    • Slides are available in 4:3 & 16:9
    • Well-crafted template with instant download.
    • Get slides that are 100% customizable and easy to download
    Advertisement

    You May Also Like These PowerPoint Templates

    Add to Wishlist
    Download
    AI Customize
    KPI dashboard slide with metrics for Visits, Visitors, Conversion rate, and Revenue per user along with views per device.
    Add to Wishlist
    Download
    AI Customize
    Best Dashboard Sales Performance Reports Revenue Charts
    Add to Wishlist
    Download
    AI Customize
    Dashboard with bar chart comparing planned vs. actual tasks for projects, pie chart for project share, and a line graph displaying project data.
    Free
    Add to Wishlist
    Download
    AI Customize
    Bar chart with four vertical colored columns in green, blue, yellow, and red, with gray tops and captions above.
    Add to Wishlist
    Download
    AI Customize
    Bar chart in PowerPoint displaying data with titles and placeholders for example text and additional information.
    Add to Wishlist
    Download
    AI Customize
    Green themed chart layout featuring bar graphs, pie charts, line graphs, and a world map for diverse data visualization.
    Add to Wishlist
    Download
    AI Customize
    Gray slide layout with a semicircular gauge in gradient colors of red, orange, and green, and a sidebar with text.
    Add to Wishlist
    Download
    AI Customize
    Project comparison table with sections for team members, location, costs, and risk before and after changes.
    Add to Wishlist
    Download
    AI Customize
    PPT template featuring a marketing dashboard with a colorful pie chart, bar graph, and progress bars for data presentation.
    Add to Wishlist
    Download
    AI Customize
    Circular gauge template with sections in red, orange, yellow, green, and dark green, with captions on either side.
    Free
    Add to Wishlist
    Download
    AI Customize
    Executive dashboard slide with five numbered circular icons on dark blue shapes, each labeled with key principles.
    Add to Wishlist
    Download
    AI Customize
    Dashboard gauges with red, yellow, green indicators showing low, medium, high performance against a gray background.
    Free
    Add to Wishlist
    Download
    AI Customize
    Pie chart in orange, red, green, and blue sections with two text labels on either side, highlighting sales performance.
    Add to Wishlist
    Download
    AI Customize
    Dashboard gauge chart PPT template with color coded sections for big loss, loss, break even, profit, and high profit.
    Free
    Add to Wishlist
    Download
    AI Customize
    Red-themed circular gauge divided into five sections from direction to business, with a central needle indicator.
    Free
    Add to Wishlist
    Download
    AI Customize
    Six-layer bullseye diagram executive dashboard with annotations on each layer, arranged symmetrically around the circle.
    Free
    Add to Wishlist
    Download
    AI Customize
    Green radial gauge with a modern layout, surrounded by five labeled rectangular sections on a neutral background.
    Free
    Add to Wishlist
    Download
    AI Customize
    PowerPoint slide with a project dashboard showing two speedometers to represent project progress with captions.