Effective Dashboard PowerPoint Templates Design

Effective Dashboard PowerPoint Templates Design
P.ID : 52684
    455 views
    47 Downloads
    Get Custom Slides by Experts
    Instantly Access Templates in PowerPoint

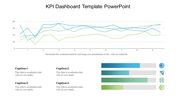
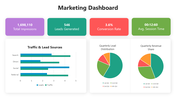
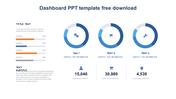
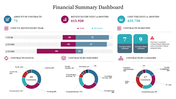
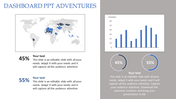
    Amazing Dashboard PowerPoint Template

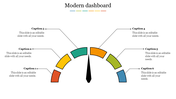
    How about trying this Dashboard PowerPoint Template for your medical presentation. The template is creative with a semi-circle, with four nodes that can be added with text. The template is mainly used for dashboard presentations and analyzing the business's growth. The template is fully customized and so editing this template is much easier. Download these user-friendly features that can make the presentation even more effective. Try now!

    Feature of the Template

    • 100% customizable slides
    • Easy to change the slide colors quickly.
    • It is easy to download.
    • Slides are available in different nodes & colors.
    • The slide contained 16:9 and 4:3 formats.
    • Well-crafted template with instant download facility.
    • Creative design with text area.
    Advertisement

    You May Also Like These PowerPoint Templates

    Free
    Add to Wishlist
    Download
    AI Customize
    KPI dashboard slide showcasing various business metrics through colorful bar charts, pie charts, and a gauge meter.
    Add to Wishlist
    Download
    AI Customize
    KPI format slide displaying financial performance metrics with detailed charts and figures.
    Free
    Add to Wishlist
    Download
    AI Customize
     Sales Dashboard PPT Template & Google Slide Themes
    Add to Wishlist
    Download
    AI Customize
    Three speedometer charts slide with captions indicating different data points, highlighted in green, yellow, and orange.
    Free
    Add to Wishlist
    Download
    AI Customize
    Free Dashboard PowerPoint Template Design template
    Add to Wishlist
    Download
    AI Customize
    Three semi circle gauges in pastel colors, with percentage labels above, and related text and icons beneath.
    Add to Wishlist
    Download
    AI Customize
    Three speedometers showing progress percentages: 25%, 50%, and 75%, with gradient colors in yellow, orange, and red.
    Free
    Add to Wishlist
    Download
    AI Customize
    Slide with three gauge meters in orange, yellow, and gray, each paired with a table for KPI metrics.
    Free
    Add to Wishlist
    Download
    AI Customize
    KPI presentation template displaying colorful charts for revenue, units sold, and product category analysis.
    Free
    Add to Wishlist
    Download
    AI Customize
    Effective Project Dashboard PowerPoint Presentation
    Free
    Add to Wishlist
    Download
    AI Customize
    Project management dashboard slide showing various tasks in planning, design with workload, and budget charts.
    Add to Wishlist
    Download
    AI Customize
    Speedometer clipart slide featuring three gauges at 25%, 50%, and 75% with space for descriptive text below each.
    Free
    Add to Wishlist
    Download
    AI Customize
    KPI slide displaying key performance indicators with many sections and accompanying data charts.
    Add to Wishlist
    Download
    AI Customize
    Dashboard slide showcasing project management KPIs with bar graphs, a line graph, and a pie chart in different colors.
    Add to Wishlist
    Download
    AI Customize
    Project management dashboard with charts for budget, progress, risks, workload, and projected launch date and icons.
    Add to Wishlist
    Download
    AI Customize
    PowerPoint slide with KPI dashboard metrics, including revenue, sales by month, and customer revenue comparison.
    Free
    Add to Wishlist
    Download
    AI Customize
    KPI Dashboard with bubbles for sales, attendance, download, and report and a client location legend.
    Add to Wishlist
    Download
    AI Customize
    KPI Training slide featuring a social media analysis table with metrics for followers, mentions, interactions, and shares.
    Add to Wishlist
    Download
    AI Customize
    Task management dashboard slide showing task numbers and completion percentages with colored gauge icons.