Attractive Project Status Dashboard PPT Presentation

 Canva
Canva
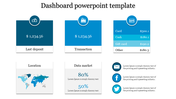

Project Status Dashboard PPT Presentation
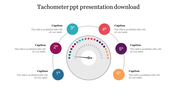
The Project Status Dashboard PPT Presentation provides a comprehensive view of the status of four distinct projects spanning different countries. It visualizes the progression of each project, offering a clear comparison of their stages of completion.
Ideal for project managers, team leaders, or executives seeking an effective tool to communicate project statuses, identify bottlenecks, and facilitate decision-making. Suitable for project reviews, stakeholder meetings, or progress assessments.
Tailored for project managers, team leads, and executives involved in multi-country projects. Also useful for stakeholders or clients desiring a succinct overview of project statuses.
Use this template during project review meetings, stakeholder updates, or periodic performance assessments.
Template Features
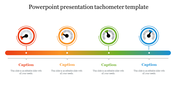
- Clear visualization of project status across different countries
- Comparative analysis of project stages
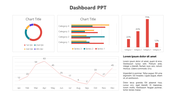
- Overall status summary for all projects
- Compatible with "16:9", "4:3", and zip formats
Download right right now


You May Also Like These PowerPoint Templates
Add to Wishlist
Download
AI Customize

Add to Wishlist
Download
AI Customize


Add to Wishlist
Download
AI Customize

Add to Wishlist
Download
AI Customize

Add to Wishlist
Download
AI Customize

Add to Wishlist
Download
AI Customize

Add to Wishlist
Download
AI Customize

Add to Wishlist
Download
AI Customize

Add to Wishlist
Download
AI Customize

Add to Wishlist
Download
AI Customize

Add to Wishlist
Download
AI Customize

Add to Wishlist
Download
AI Customize

Add to Wishlist
Download
AI Customize

Add to Wishlist
Download
AI Customize

Add to Wishlist
Download
AI Customize


Free
Add to Wishlist
Download
AI Customize

Add to Wishlist
Download
AI Customize

