Effective KPI Dashboard PPT Template and Google Slides


Amazing KPI Dashboard PowerPoint Template
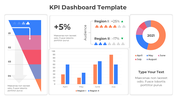
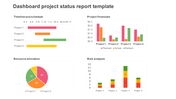
Download this KPI Dashboard Template PowerPoint Slide to visualize the key performance of your business more effectively. Using this unique template, you can keep track of your company's wealth, provide an easy interpretation of data, improve your organization's performance, etc. The different types of charts used in this template help to quickly present the actual data. You can use this template for making clear presentations on sales, marketing, manufacturing, finance, human resource, E-commerce, customer service, etc.
About the template:
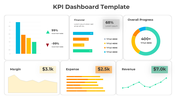
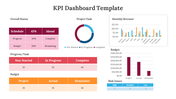
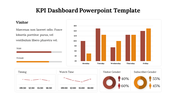
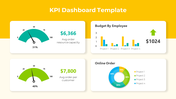
This five-noded KPI Dashboard Template PowerPoint Slide comes with five charts that help to present your business performance tracking. Using this template, you can present the data related to costs, allocation, bourn time, status, and dashboard. The multi-color scheme used in this template helps differentiate the data according to quarters, series, months, etc. The font style and size are clear to understand. This KPI PowerPoint Template is fully editable. You can revise its appearance according to your requirement.
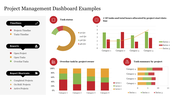
The KPI Dashboard PowerPoint Slide is ready-to-use, so there is no need to be an expert in using this template. You can replace the data given in the slide with your data to make an informative presentation. Using this slide, you can present your product delivery timeline, supply chain management, employees performance tracking, quality control management, project status, business performance, risk management, etc.
Features of this slide:
1. 100 % customizable slides and easy to download.
2. Slides available in different nodes & colors.
3. The slide contained 16:9 and 4:3 format.
4. Easy to change the slide colors quickly.
5. Well-crafted template with instant download facility.
6. The multi-color charts will give an attractive look to your dashboard presentation.


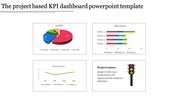
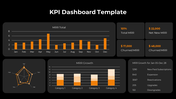
You May Also Like These PowerPoint Templates
Add to Wishlist
Download
Edit

Add to Wishlist
Download
Edit


Add to Wishlist
Download
Edit

Add to Wishlist
Download
Edit

Add to Wishlist
Download
Edit

Add to Wishlist
Download
Edit

Add to Wishlist
Download
Edit

Add to Wishlist
Download
Edit

Add to Wishlist
Download
Edit


Add to Wishlist
Download
Edit


Free
Add to Wishlist
Download
Edit

Free
Add to Wishlist
Download
Edit


Showing20 of69,218 templates