Editable KPI Dashboard Template PowerPoint And Google Slides

KPI dashboard template displaying total, growth, churned, and net new MRR with bar and radar charts on a dark backdrop.
P.ID : 1792
    5.2K+ views
    473 Downloads
    Get Custom Slides by Experts
    Instantly Access Templates in PowerPoint

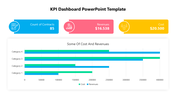
    Amazing KPI Dashboard PowerPoint Slide


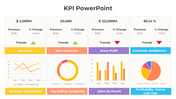
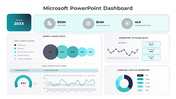
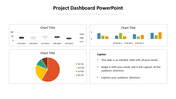
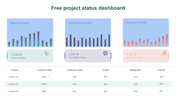
    Unveil the power of strategic performance monitoring with the KPI dashboard, a dynamic tool designed to streamline data analysis and drive informed decision-making. By consolidating key performance indicators (KPIs) into a visually intuitive format, this dashboard offers a comprehensive snapshot of organizational performance across various metrics. From sales figures to operational efficiency and financial health, the KPI dashboard provides valuable insights that empower teams to identify trends, pinpoint areas for improvement, and capitalize on opportunities for growth. Ideal for business executives, managers, analysts, and professionals across industries, Kpi Dashboard PowerPoint template simplifies the process of creating customized KPI dashboards. With its pre-designed slides and fully editable features, users can seamlessly integrate relevant data and metrics tailored to their specific needs and objectives. From tracking progress towards strategic goals to fostering a culture of accountability and transparency, this template equips presenters with the tools they need to effectively communicate insights and drive actionable outcomes. Elevate your presentations and propel your organization towards success with the KPI dashboard template – a valuable resource for driving performance excellence and achieving business objectives.


    Features of this template


    • 100% customizable slides and easy to download.
    • Slides are available in different nodes & colors.
    • The slide contains 16:9 and 4:3 formats.
    • Easy to change the colors of the slide quickly.
    • Highly compatible with PowerPoint and Google Slides.
    • Well-crafted template with an instant download facility.
    Advertisement

    You May Also Like These PowerPoint Templates

    Add to Wishlist
    Download
    AI Customize
    Colorful tachometer PowerPoint slide design with transportation icons including airplane, car, bus, and train with captions.
    Add to Wishlist
    Download
    AI Customize
    Ten speedometer icons in two rows, each with blue, green, and red segments, ranging from 0 to 100.
    Add to Wishlist
    Download
    AI Customize
    Tachometer slide with four gauges in orange, red, blue, and green, each with captions below describing different readings.
    Add to Wishlist
    Download
    AI Customize
    Dashboard with bar charts, line graphs, and a gauge chart in various colors and a percentage indicator, on white background.
    Add to Wishlist
    Download
    AI Customize
    Dashboard template with three fuel gauge icons, each showing different fuel levels with placeholder text.
    Add to Wishlist
    Download
    AI Customize
    KPI dashboard layout with a yellow header, two gauge in teal and green, bar metrics, and pie charts on a light background.
    Add to Wishlist
    Download
    AI Customize
    Seven rectangular sections with financial data on top and visual charts below, bordered in blue with organized text.
    Add to Wishlist
    Download
    AI Customize
    Speedometer graphic with six sections from green to red color gradient, each with icons and text areas.
    Add to Wishlist
    Download
    AI Customize
    Semi circular meter template with green, lime, yellow, and red sections, each displaying thumbs up icons, and text.
    Free
    Add to Wishlist
    Download
    AI Customize
    Effective Speedometer PowerPoint Template Presentation
    Add to Wishlist
    Download
    AI Customize
    Executive dashboard with a portfolio summary table listing project details and a pie chart displaying a quarterly report.
    Add to Wishlist
    Download
    AI Customize
    Dashboard template showing main categories, team metrics, and performance details with various visual elements.
    Add to Wishlist
    Download
    AI Customize
    Tachometer slide featuring a dial with a needle pointing to colored segments and four caption areas.
    Add to Wishlist
    Download
    AI Customize
    Set of three speedometer gauges indicating 70%, 50%, and 55%, with placeholder text areas placed in a white backdrop.
    Add to Wishlist
    Download
    AI Customize
    Central black speedometer with four surrounding colored icons, each detailing various aspects of kilometers.
    Add to Wishlist
    Download
    AI Customize
    Dashboard template showing a line chart of page likes over months with marked events in June and August.