Best PowerPoint Dashboard Templates For Presentation

Circular dashboard graphic with five colored sections labeled surrounding a central gauge with a red needle.
P.ID : 9008
    852 views
    106 Downloads
    Get Custom Slides by Experts
    Instantly Access Templates in PowerPoint

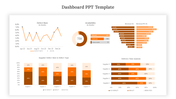
    What is a PowerPoint Dashboard Template?

    PowerPoint dashboard template is a one-page Microsoft Word document that will allow you to present your statistics and information in an organized manner on a dashboard page. What is the difference between a Dashboard PowerPoint template


    A PowerPoint dashboard template is used to create a dashboard that can be used as a starter template for new or existing users of Microsoft's Microsoft SharePoint Server. How can you make the most of a dashboard page with your information? The good idea is to show the information in a standardized format that will be easy to understand for your visitors.

    This makes the information easier to read. To get started, you can write down the information that you want your visitors to see, such as salesperson names, team names, and product names.

    Then you will need to select a template that includes some necessary information that you need to include in your PowerPoint dashboard template. In a well-designed dashboard template, you can have company logos, product logos, and other information to help you build your dashboard.

    Features of this template:

    1. 100% customizable slides and easy to download.
    2. Slides available in different nodes & colors.
    3. The slide contained 16:9 and 4:3 format.
    4. Easy to change the slide colors quickly.
    5. Well-crafted template with instant download facility.

    Advertisement

    You May Also Like These PowerPoint Templates

    Add to Wishlist
    Download
    AI Customize
    Cash flow dashboard with a vertical bar chart and two horizontal stacked bar charts detailing revenue categories.
    Add to Wishlist
    Download
    AI Customize
    Blue themed dashboard layout with a line chart, two growth metrics, and three semi circle gauges for budget.
    Add to Wishlist
    Download
    AI Customize
    Three circular dashboard dials with red, blue, and brown segments, each containing captions below.
    Add to Wishlist
    Download
    AI Customize
    Slide featuring a dashboard with three dials labeled Low, Mid, and High, indicating various levels of measurement.
    Free
    Add to Wishlist
    Download
    AI Customize
    Circular speedometer with orange and gray segments, displaying kilometer markings from 5.5 KM to 8 KM.
    Free
    Add to Wishlist
    Download
    AI Customize
    Dashboard graphic featuring a circular speedometer with a red needle, surrounded by text labels for various business metrics.
    Add to Wishlist
    Download
    AI Customize
    Speedometer slide with three colorful gauges showing percentages each with captions.
    Add to Wishlist
    Download
    AI Customize
    Dashboard with a red line graph for Jan-May and a bar chart of four colored percentage bars and category icons.
    Free
    Add to Wishlist
    Download
    AI Customize
    PowerPoint slide showcasing projected cash flows, NPV for 3 and 5 years, and payback period with client testimonial.
    Free
    Add to Wishlist
    Download
    AI Customize
    Dashboard with line chart for appointments, bar chart from hospital earnings to patient totals, and intake by category.
    Add to Wishlist
    Download
    AI Customize
    Slide deck of energy dashboards displaying data visualizations like pie charts, bar and line graphs, in green shades.
    Free
    Add to Wishlist
    Download
    AI Customize
    Dashboard layout with three semicircular gauges in orange and brown tones, paired with captions, on a beige background.
    Add to Wishlist
    Download
    AI Customize
    Project management dashboard with bar charts, numerical data panels, and color-coded sections.
    Add to Wishlist
    Download
    AI Customize
    Four colored circular progress, one is higlighted in a box with a pie chart, and a bar chart labelled with sections.
    Add to Wishlist
    Download
    AI Customize
    Comprehensive program dashboard featuring charts and gauges for quality, budget, risks, overall project map, progress, and resource updates.
    Free
    Add to Wishlist
    Download
    AI Customize
    Four black speedometers with white numbers and yellow markers arranged in a two by two grid with descriptions.