MILESTONE 🌟 5 Million+ creative minds trust SlideEgg! Grab 80% OFF

Best PowerPoint Speedometer Template for Data Visualization

Two blue speedometers with gray needle pointing percentage labels, with corresponding captions beneath.
P.ID : 16988
    391 views
    45 Downloads
    Get Custom Slides by Experts
    Instantly Access Templates in PowerPoint

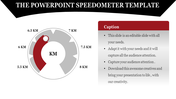
    Drive Your Presentation Forward with Speedometer Template


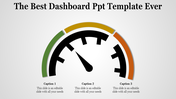
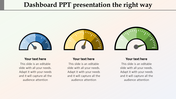
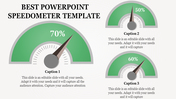
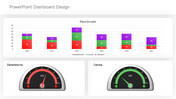
    Rev up your presentations with our Speedometer PowerPoint Template and Google Slides Themes. It has two sleek speedometers adorned with percentage levels. This template empowers you to convey progress, performance, and milestones. With a captivating blue theme, each speedometer includes a text area and a caption, allowing you to highlight key metrics and goals effectively.

    Ideal for anyone in sales, project management, finance, and performance analysis, our Speedometer template enables you to engage your audience and drive home your message with clarity and impact. Accelerate your presentations today and leave a lasting impression with our template.

    Features of the template


    • 100% customizable slides are easy to download.
    • Slides are available in different colors.
    • The slide has 4:3 and 16:9 formats.
    • It is easy to change the slide colors quickly.
    • It has a cute design to impress an audience.
    • Create feature-rich, animated presentations.
    Advertisement

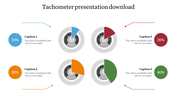
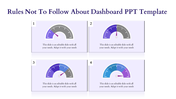
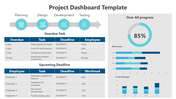
    You May Also Like These PowerPoint Templates

    Add to Wishlist
    Download
    AI Customize
    Dashboard slide with a pie chart, stacked area chart, and multiple colored rectangular boxes displaying metrics.
    Add to Wishlist
    Download
    AI Customize
    KPI dashboard slide with metrics for Visits, Visitors, Conversion rate, and Revenue per user along with views per device.
    Add to Wishlist
    Download
    AI Customize
    Best Dashboard Sales Performance Reports Revenue Charts
    Add to Wishlist
    Download
    AI Customize
    Dashboard with bar chart comparing planned vs. actual tasks for projects, pie chart for project share, and a line graph displaying project data.
    Add to Wishlist
    Download
    AI Customize
    Green themed chart layout featuring bar graphs, pie charts, line graphs, and a world map for diverse data visualization.
    Add to Wishlist
    Download
    AI Customize
    Gray slide layout with a semicircular gauge in gradient colors of red, orange, and green, and a sidebar with text.
    Add to Wishlist
    Download
    AI Customize
    Executive dashboard with four blue horizontal boxes containing text and a smiling cartoon man gesturing on the right.
    Add to Wishlist
    Download
    AI Customize
    Dashboard with a multi-colored semicircular gauge divided into four sections, labeled 01 to 04, and captions on the right.
    Add to Wishlist
    Download
    AI Customize
    Central tachometer gauge surrounded by six numbered circles in blue, red, teal, orange, purple, and yellow, in an arc layout.
    Add to Wishlist
    Download
    AI Customize
    Business analysis dashboard with a bar chart and an illustrated man holding a pointer in a dark background.
    Add to Wishlist
    Download
    AI Customize
    Dashboard slide with a speedometer gauge in red, blue, yellow, and teal, and text bullet points on the left.
    Add to Wishlist
    Download
    AI Customize
    PPT template featuring a marketing dashboard with a colorful pie chart, bar graph, and progress bars for data presentation.
    Add to Wishlist
    Download
    AI Customize
    Green themed diagram illustrating stages of analysis delivery, from data source to client reports and dashboards.
    Add to Wishlist
    Download
    AI Customize
    A slide showcasing four different chart types from Column Histogram to Scatter Plot with corresponding data.
    Add to Wishlist
    Download
    AI Customize
    Project summary dashboard showing project statistics, budget, actual performance, and project performance by category.
    Add to Wishlist
    Download
    AI Customize
    Circular gauge template with sections in red, orange, yellow, green, and dark green, with captions on either side.
    Add to Wishlist
    Download
    AI Customize
    Sashboard design featuring three plant species data and corresponding progress meters in red, green, and blue.