Creative Dashboard PPT Presentation Template - Three Nodes

PowerPoint slide showing three dashboard gauges with placeholder text for performance or data metrics.
P.ID : 4170
    363 views
    25 Downloads
    Get Custom Slides by Experts
    Instantly Access Templates in PowerPoint

    Creative Dashboard PowerPoint Template


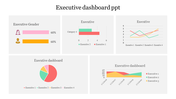
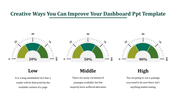
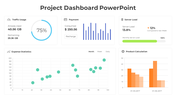
    Unlock the potential of impactful data communication with our Dashboard Presentation Slide. Professionals, analysts, and executives use this slide with three vibrant speedometers, each adorned with a unique color scheme, creating a visually appealing and engaging presentation.

    The strategically placed text areas accompanying each speedometer are perfect for presenting your key data points. Whether you're showcasing performance metrics, financial indicators, or project progress, this slide ensures your information is presented with clarity and sophistication.

    Ready to elevate your data presentations? Click now to access the Dashboard Presentations, where dynamic visuals meet precision. Propel your presentations, engage your audience, and convey your data with confidence. Your journey to impactful data presentations starts here!

    Features of the template


    • 100% customizable slides are easy to download.
    • Slides are available in different colors.
    • The slide has 4:3 and 16:9 formats.
    • It is easy to change the slide colors quickly.
    • It has a cute design to impress an audience.
    • Create feature-rich, animated presentations.
    Advertisement

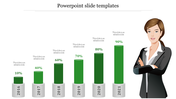
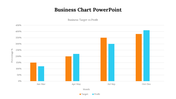
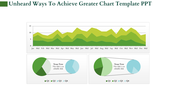
    You May Also Like These PowerPoint Templates

    Free
    Add to Wishlist
    Download
    AI Customize
    Green radial gauge with a modern layout, surrounded by five labeled rectangular sections on a neutral background.
    Add to Wishlist
    Download
    AI Customize
    Colorful dashboard PPT slide with world map, pie charts, bar graphs, and metrics with placeholder text.
    Free
    Add to Wishlist
    Download
    AI Customize
    KWL chart PowerPoint template with sections for What I Know, What I Want to Know, and What I Learned with placeholder text.
    Add to Wishlist
    Download
    AI Customize
    Use Dashboard PPT Template Slide Designs
    Add to Wishlist
    Download
    AI Customize
    Slide with three donut shaped percentage charts showing 70%, 50%, and 90%, with corresponding captions beneath each.
    Add to Wishlist
    Download
    AI Customize
    Gantt chart in blue tones, showing task progress over weeks with horizontal bars and assigned team members.
    Free
    Add to Wishlist
    Download
    AI Customize
    Dashboard template with three colorful gauge icons in the center and text boxes in green, blue, and gold.
    Free
    Add to Wishlist
    Download
    AI Customize
    PowerPoint slide with a project dashboard showing two speedometers to represent project progress with captions.
    Add to Wishlist
    Download
    AI Customize
    KPI dashboard with bar graphs showing data trends over time and two green summary boxes.
    Free
    Add to Wishlist
    Download
    AI Customize
    Dashboard PPT template featuring a speedometer with labeled sections like Direction, Objectives, Data, Business, and Study.
    Add to Wishlist
    Download
    AI Customize
    Vehicle dashboard slide featuring a speedometer on the left and a detailed table on the right with its brands.
    Free
    Add to Wishlist
    Download
    AI Customize
    A PPT chart template featuring a table layout with rows labeled Text and columns with bar charts in different shades of blue.
    Add to Wishlist
    Download
    AI Customize
    Bar chart slide design with stacked bars showing three categories per item and percentage captions on the left.
    Add to Wishlist
    Download
    AI Customize
    Business column chart template showing four bar sections, each representing industries with icons and data percentages.
    Add to Wishlist
    Download
    AI Customize
    Colorful bar chart slide for an annual report in PowerPoint, displaying monthly data from January to December.
    Add to Wishlist
    Download
    AI Customize
    Colorful bar chart PPT template displaying four sections with data values and corresponding captions for 2018 to 2021.
    Add to Wishlist
    Download
    AI Customize
    Gantt chart with a task breakdown, progress percentages, and a status table for project planning and execution.
    Free
    Add to Wishlist
    Download
    AI Customize
    Line chart with data points marked by blue squares and black dots, displaying values from 2006 to 2014.