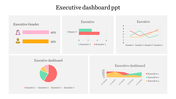
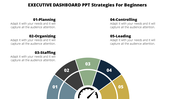
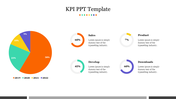
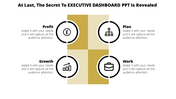
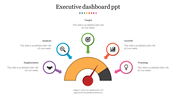
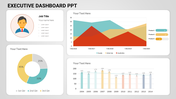
Executive Dashboard PowerPoint Template for Analysis


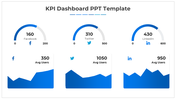
Dashboard PowerPoint Template
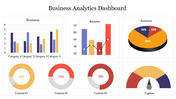
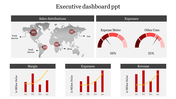
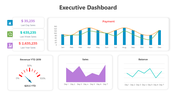
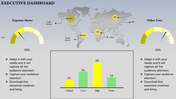
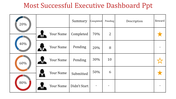
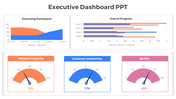
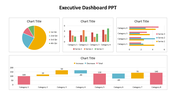
Step into the realm of dashboards, where data seamlessly transforms into insights at a glance. More than a visual display, a dashboard is a dynamic tool that consolidates information, offering a comprehensive overview of key metrics and trends. Empowering users to monitor performance, identify patterns, and make swift, informed decisions, dashboards streamline complex data into a visually intuitive interface. Whether for business analytics, project tracking, or performance evaluation, embracing the power of dashboards enhances efficiency and facilitates strategic decision-making. Professionals across various sectors, including business analysts, project managers, and executives, can leverage this fully editable template with a user-friendly interface and customizable slides. It becomes a versatile tool for visually presenting data in meetings, reports, or presentations, simplifying complex information, improving audience comprehension and engagement. The benefits for presenters include enhanced communication, streamlined data presentation, and efficient information sharing, encouraging the audience to utilize this template for transforming data into compelling visual narratives that drive understanding, strategic insights, and informed decision-making.
Features of this template
- 100% customizable slides and easy to download.
- Slides are available in different nodes & colors.
- The slide contained 16:9 and 4:3 formats.
- Easy to change the slide colors quickly.
- It is a well-crafted template with an instant download facility.
- Highly compatible with PowerPoint and Google Slides.


You May Also Like These PowerPoint Templates
Add to Wishlist
Download
Edit

Add to Wishlist
Download
Edit

Add to Wishlist
Download
Edit

Add to Wishlist
Download
Edit

Add to Wishlist
Download
Edit

Add to Wishlist
Download
Edit

Add to Wishlist
Download
Edit

Add to Wishlist
Download
Edit


Add to Wishlist
Download
Edit

Add to Wishlist
Download
Edit

Add to Wishlist
Download
Edit

Add to Wishlist
Download
Edit

Add to Wishlist
Download
Edit


Free
Add to Wishlist
Download
Edit

Free
Add to Wishlist
Download
Edit


Showing20 of69,218 templates