Best Executive Dashboard PPT And Google Slides Template

Executive dashboard slide displaying many charts from new business to operational expenses.
P.ID : 3820
    1.2K+ views
    115 Downloads
    Get Custom Slides by Experts
    Instantly Access Templates in PowerPoint

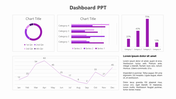
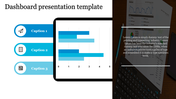
    Executive Dashboard PowerPoint Slide


    Empower your executive presentations with our executive dashboard PPT template, meticulously designed to streamline data visualization and decision-making processes. This comprehensive template offers a helpful content base, enabling executives to track key performance indicators, monitor progress, and make informed decisions effectively. With 100% editable and customizable elements, executives can tailor the dashboard to their specific needs and preferences effortlessly. Drive strategic initiatives and foster data-driven decision-making with ease. Download this executive dashboard PPT and Google Slides template today and transform your presentations into powerful tools for executive insight and action. With its user-friendly features and professional design, this template is your gateway to creating impactful executive dashboards that drive organizational success.


    Features of this template


    • 100% customizable slides and easy to download.
    • The slide contains 16:9 and 4:3 formats.
    • Easy to change the colors of the slide quickly.
    • Highly compatible with PowerPoint and Google Slides.
    Advertisement

    You May Also Like These PowerPoint Templates

    Add to Wishlist
    Download
    AI Customize
    Dashboard layout with horizontal bar charts and circular progress indicators in green, yellow, orange, and blue.
    Add to Wishlist
    Download
    AI Customize
    Amazing PowerPoint Dashboard Presentation Template
    Add to Wishlist
    Download
    AI Customize
    Circular tachometer gauge with a needle pointing six colored sections, and captions in rounded rectangles connected by lines.
    Free
    Add to Wishlist
    Download
    AI Customize
    Circular gauge style infographic in shades of gray, showing a speedometer with a needle and distance markers.
    Add to Wishlist
    Download
    AI Customize
    Business executive dashboard template displaying project information, including date and editor with placeholder text.
    Add to Wishlist
    Download
    AI Customize
    A tachometer PowerPoint template with five dials in different colors, each representing a specific section with captions.
    Add to Wishlist
    Download
    AI Customize
    Dashboard themed slide with a semi circular gauge showing four icons for speedometers and a central needle pointer.
    Add to Wishlist
    Download
    AI Customize
    Dashboard layout with gauges, bar charts, line graphs, and progress indicators for business performance metrics.
    Add to Wishlist
    Download
    AI Customize
    Business dashboard with expense bar chart, executive distribution, sales pie chart, and revenue gauge.
    Add to Wishlist
    Download
    AI Customize
    Green speedometer graphics illustrating performance levels at 70, 50, 55, and 85 percent in a PowerPoint template.
    Add to Wishlist
    Download
    AI Customize
    Chart template featuring bar, line, and calendar charts with editable placeholders for Q1, Q2, and monthly data.
    Add to Wishlist
    Download
    AI Customize
    A tachometer graphic for PowerPoint, featuring different colored sections and text placeholders.
    Add to Wishlist
    Download
    AI Customize
    Four yellow speedometer graphics showing percentages of 70%, 50%, 55%, and 85% placed in a white background.
    Add to Wishlist
    Download
    AI Customize
    Dashboard with a bar chart and pie chart in purple shades, comparing project status across regional shares.
    Add to Wishlist
    Download
    AI Customize
    Dashboard PowerPoint template with progress bars, circular steps, and a multi color bar chart for tracking metrics.
    Add to Wishlist
    Download
    AI Customize
    Dashboard template showing last deposit, transaction, payment types, and data market percentages.
    Add to Wishlist
    Download
    AI Customize
    Colorful speedometer PPT slide with a gauge showing 25 percent and corresponding happy and sad faces with captions.