Best PowerPoint Speedometer Template for Measuring Success

 Canva
Canva
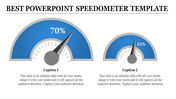
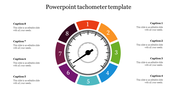
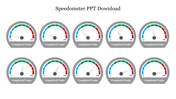
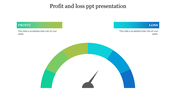
PowerPoint Speedometer Template
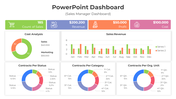
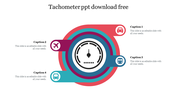
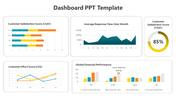
Refresh your dashboard presentations with our simplest PowerPoint Speedometer Template and Google Slides. The slide comes with three speedometers. Each of them displays different percentage values and varying sizes. It further allows users to visually represent progress, performance or goals with ease. It helps to provide context for each speedometer, such as project milestones, sales targets or performance metrics.
A suitable template for delivering a business update, presenting quarterly results or setting targets for the upcoming year. Download now to convey important information and drive engagement. Ideal for professionals in sales, marketing, project management and performance analysis. Download now to communicate and showcase key metrics to your audience.
Features of the template
- The slide contains 16:9 and 4:3 formats.
- Compatible with Google slide themes and PowerPoint.
- 100% customizable slides and easy to download.
- It is easy to change the colors of the slide quickly.
- Well-crafted template with an instant download facility.


You May Also Like These PowerPoint Templates
Add to Wishlist
Download
AI Customize

Add to Wishlist
Download
AI Customize

Add to Wishlist
Download
AI Customize

Add to Wishlist
Download
AI Customize

Add to Wishlist
Download
AI Customize

Add to Wishlist
Download
AI Customize

Add to Wishlist
Download
AI Customize

Add to Wishlist
Download
AI Customize


Add to Wishlist
Download
AI Customize

Add to Wishlist
Download
AI Customize

Add to Wishlist
Download
AI Customize

Add to Wishlist
Download
AI Customize

Add to Wishlist
Download
AI Customize

Free
Add to Wishlist
Download
AI Customize

Add to Wishlist
Download
AI Customize

Add to Wishlist
Download
AI Customize

Add to Wishlist
Download
AI Customize

Add to Wishlist
Download
AI Customize
