Editable Expense Dashboard PowerPoint And Google Slides

 Canva
Canva
Expense Dashboard PPT, Google Slides, and Canva Template
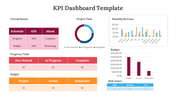
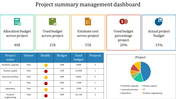
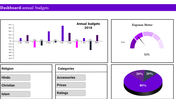
An expense dashboard is a visual representation of financial data that consolidates expenses, income, and balance summaries into an easy-to-understand format. Designed for professionals, students, and anyone managing finances, this tool simplifies financial analysis by offering insights into fixed costs, variable expenses, and monthly spending trends.
Purpose Of The Slides
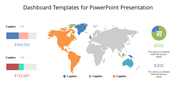
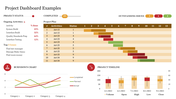
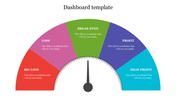
This expense dashboard template serves as a perfect tool to present detailed financial insights during meetings, project evaluations, or classroom discussions. It features a multicolor theme and customizable elements, ensuring that users can tailor the layout to match their data and style preferences. The design emphasizes clarity and professionalism, allowing you to effectively communicate complex financial information with ease.
Who Can Use It?
Whether you are a financial analyst, business owner, student, or educator, this slide is tailored for diverse needs. Professionals can use it to showcase budget analysis and expenditure trends. Students can leverage it for academic projects or case studies on financial planning. It's a versatile solution for anyone looking to present financial data in a visually appealing and organized manner.
Special Key Features
Download this expense dashboard PPT template today and elevate your presentations with a professional and polished design. Gain clarity in financial reporting and make data-driven decisions with confidence!
Features of this template
- 100% customizable slides and easy to download.
- The slides contain 16:9 and 4:3 formats.
- Easy to change the colors quickly.
- Highly compatible with PowerPoint, Google Slides, and Canva Presentation.


You May Also Like These PowerPoint Templates

Add to Wishlist
Download
Edit

Add to Wishlist
Download
Edit


Add to Wishlist
Download
Edit

Add to Wishlist
Download
Edit

Add to Wishlist
Download
Edit

Add to Wishlist
Download
Edit

Add to Wishlist
Download
Edit

Add to Wishlist
Download
Edit

Add to Wishlist
Download
Edit

Add to Wishlist
Download
Edit

Add to Wishlist
Download
Edit

Add to Wishlist
Download
Edit


Add to Wishlist
Download
Edit

Add to Wishlist
Download
Edit

Add to Wishlist
Download
Edit
