Editable PowerPoint and Google Slides Dashboard Design In Circle Model

 Canva
Canva


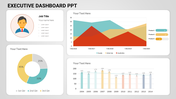
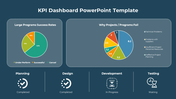
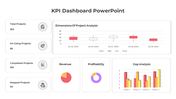
Dashboard PowerPoint Template and Google Slides Themes
Get ahead of the curve with our Dashboard PowerPoint Template and Google Slides Themes, designed for the discerning professional. This innovative template offers a trifecta of functionality with three nodes, each equipped with a caption holder, title holder, and expansive text area.
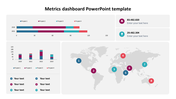
Perfect for data visualization, project management updates, or executive briefings, its crisp white background ensures your content pops with clarity and impact. Whether you're a savvy marketer, a meticulous project manager, or a data-driven executive, this template empowers you to craft compelling presentations that captivate your audience.
Seamlessly integrate graphs, charts, and KPIs into your slides, guiding your viewers through complex information with ease. Download our Dashboard PowerPoint Template today and elevate your data storytelling to new heights!
Features of the Template
- 100 % customizable slides.
- The slide show is in 4:3, 16:9, zip format.
- There is powerful connectivity with Google Slides and PowerPoint.
- It is simple and quick to alter the slide's color.
- An efficient template that can be easily accessed immediately.
- Well-crafted template with an instant download facility.


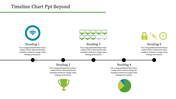
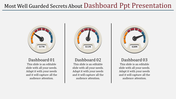
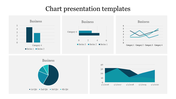
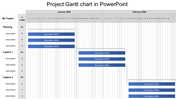
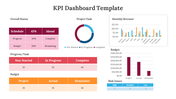
You May Also Like These PowerPoint Templates
Add to Wishlist
Download
Edit

Add to Wishlist
Download
Edit

Add to Wishlist
Download
Edit


Add to Wishlist
Download
Edit

Add to Wishlist
Download
Edit

Add to Wishlist
Download
Edit

Add to Wishlist
Download
Edit

Add to Wishlist
Download
Edit

Add to Wishlist
Download
Edit


Add to Wishlist
Download
Edit


Free
Add to Wishlist
Download
Edit

Free
Add to Wishlist
Download
Edit


