Top Notch Chart For KPI Dashboard Template PowerPoint


Best KPI Dashboard Template:
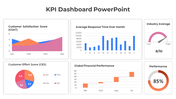
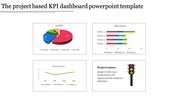
A KPI dashboard template PowerPoint is an arrangement of a PowerPoint introduction containing business data as diagrams, charts, and records. The reason for making this introduction is to give an entrepreneur a quick outline of an assortment of business-related measurements.
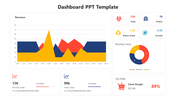
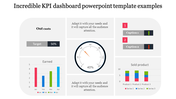
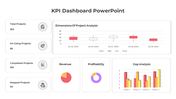
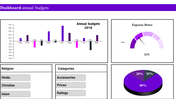
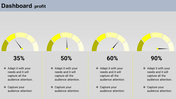
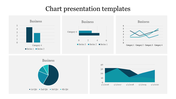
These templates consist of six nodes for you to easily place your text in a given space quickly in an organized way. These templates have a multi-color option for you to display your content attractive and colorfully. This template contains a bar graph, pie chart in a more creative and attractive manner. By using these various graphs, you can display the growth and loss of the sales, number of visitors who visited the property in a clear and accurate way,
Our templates can be totally edited and easily customized as per your preference. Moreover, using our impressive template, you can attract viewers efficiently. By using our ready-made slide, you can make a quick presentation.
Features of this slide:
- 100% customizable slides and easy to download.
- Slides available in different nodes & colors.
- The slide contained 16:9 and 4:3 format.
- Easy to change the slide colors quickly.
- Well-crafted template with instant download facility.
- Contains graphs and pie charts to display the contents accurately.


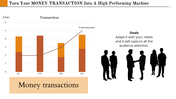
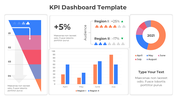
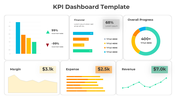
You May Also Like These PowerPoint Templates
Add to Wishlist
Download
Edit

Add to Wishlist
Download
Edit

Add to Wishlist
Download
Edit

Add to Wishlist
Download
Edit

Add to Wishlist
Download
Edit

Add to Wishlist
Download
Edit

Add to Wishlist
Download
Edit


Add to Wishlist
Download
Edit

Add to Wishlist
Download
Edit

Add to Wishlist
Download
Edit


Add to Wishlist
Download
Edit


Free
Add to Wishlist
Download
Edit

Free
Add to Wishlist
Download
Edit


Showing20 of69,218 templates