Impressive KPI Dashboard PowerPoint and Google Slides Template

 Canva
Canva
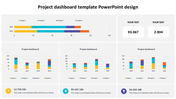
KPI Dashboard PowerPoint Template
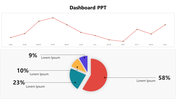
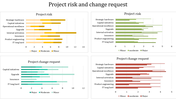
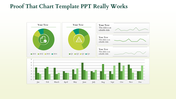
Bring out the power of data visualization with our KPI Dashboard PowerPoint Template. The slide comes with a backdrop of simplicity with four strategic sections. The first section is a circular pie chart that vividly illustrates cost distribution. It provides stakeholders with a quick overview of resource allocation. The second section utilizes horizontal bar charts to portray value fluctuations. It ensures a comprehensive understanding of resource dynamics.
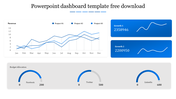
The third section employs graphical charts to offer in-depth data analysis. It empowers your team with actionable insights. In the fourth section, a traffic signal pole with three colored signals signifies project status at a glance. It serves as a visual beacon for effective decision-making. Download the template to elevate your presentation game with data driven precision.
Features of the template
- The slide contains 16:9 and 4:3 formats.
- Compatible with Google Slides Themes and PowerPoint.
- 100% customizable slides and easy to download.
- It is easy to change the colors of the slide quickly.
- Well-crafted template with an instant download facility.
- Highly compatible with PowerPoint, Google Slides and Canva templates.


You May Also Like These PowerPoint Templates

Add to Wishlist
Download
AI Customize

Add to Wishlist
Download
AI Customize


Add to Wishlist
Download
AI Customize

Add to Wishlist
Download
AI Customize

Add to Wishlist
Download
AI Customize

Add to Wishlist
Download
AI Customize

Add to Wishlist
Download
AI Customize

Add to Wishlist
Download
AI Customize

Add to Wishlist
Download
AI Customize

Add to Wishlist
Download
AI Customize

Add to Wishlist
Download
AI Customize

Add to Wishlist
Download
AI Customize

Add to Wishlist
Download
AI Customize

Add to Wishlist
Download
AI Customize

Add to Wishlist
Download
AI Customize

Add to Wishlist
Download
AI Customize

Add to Wishlist
Download
AI Customize

Add to Wishlist
Download
AI Customize
