Dashboard Project Status Report PPT Template & Google Slides

Dashboard slide displaying colorful project status with timeline, financials, resource allocation, and risk analysis charts.
P.ID : 41699
    3.3K+ views
    354 Downloads
    Get Custom Slides by Experts
    Instantly Access Templates in PowerPoint

    Simple Dashboard Project Status Report Template

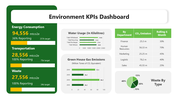
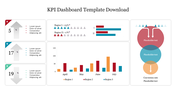
    Download the Simple Dashboard Project Status Report Template to create an attractive presentation about all project plans within the given time. This template will help you present important information about the project quickly. The image on the slide will help your team get an idea about your project status. You can include text, graphics in your PPT to make it look excellent. Users can use this template in project status meetings or business meetings.

    About this template:

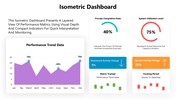
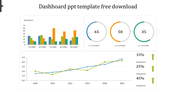
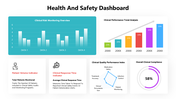
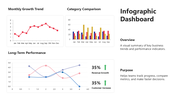
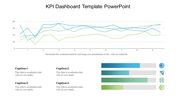
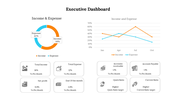
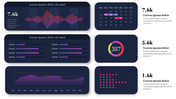
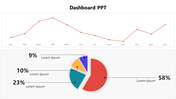
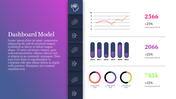
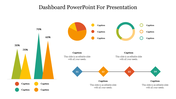
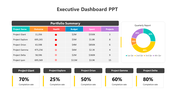
    It is a multicolor template with a white background. This template has different types of graphs that help you to present important information to the audience. This template is easily understandable by people who are new to your project. This slide has a beautiful design with creative business icons and multiple nodes. In addition, We also have a wide range of slides for a project PowerPoint slide.

    Benefits you get from this template:

    • This template is 100% editable and free to download.
    • You can adjust the icon colors in this PowerPoint slide.
    • This template gives a message in less time so that viewers understood its purpose.
    • The template helps to show project Management.
    • We also have a collection of Title follow-up slides. You can check it later.

    Features of this template:
    • 100 % customizable slides and easy to download.
    • Slides are available in different nodes & colors.
    • This slide supports 16:9 and 4:3 format.
    • Easy to change the slide colors quickly.
    • Easily readable and acceptable template.
    • Vast Numbers of coffee slides to impress your audience.
    Advertisement

    You May Also Like These PowerPoint Templates

    Add to Wishlist
    Download
    AI Customize
    Dashboard template showing last deposit, transaction, payment types, and data market percentages.
    Add to Wishlist
    Download
    AI Customize
    Colorful speedometer PPT slide with a gauge showing 25 percent and corresponding happy and sad faces with captions.
    Add to Wishlist
    Download
    AI Customize
    Logistics performance dashboard with two circular charts for failure distribution and delivery tracking, and a gauge meter.
    Add to Wishlist
    Download
    AI Customize
    Executive dashboard presentation slide with arrows and title placeholders on a notebook background.
    Add to Wishlist
    Download
    AI Customize
    Tachometer PPT slide with 4 colorful gauges in red, orange, green, and blue, each with caption sections on a white backdrop.
    Add to Wishlist
    Download
    AI Customize
    Dashboard PowerPoint slide featuring pie, bar, and line charts with placeholder text and data visualization.
    Free
    Add to Wishlist
    Download
    AI Customize
    Business slide featuring a circular layout with four orange sections and icons representing key aspects of business.
    Add to Wishlist
    Download
    AI Customize
    Color coded modern dashboard gauge with six labeled sections and a central pointer with captions.
    Add to Wishlist
    Download
    AI Customize
    Executive dashboard slide with a gauge displaying performance across different levels, labeled three sections.
    Add to Wishlist
    Download
    AI Customize
    Slide with a businesswoman standing beside a colorful ring chart labeled on a board and four captions on the right.
    Add to Wishlist
    Download
    AI Customize
    Marketing KPI template with three circular icons, and bar and line charts in blue, gray, and green below.
    Add to Wishlist
    Download
    AI Customize
    Best Elegant Tachometer Presentation Download Template
    Free
    Add to Wishlist
    Download
    AI Customize
    Circular speedometer design with a red progress arc from 5.5 to 6.5 KM, and a gray caption box for customizable text content.
    Add to Wishlist
    Download
    AI Customize
    Speedometer style dashboard template with green, yellow, and red zones for progress tracking with captions.