Best KPI Dashboard PowerPoint Template and Google Slides

KPI dashboard layout with bar charts, a gauge, captions, and target metrics on light gray background, organized in sections.
P.ID : 18866
    2.4K+ views
    191 Downloads
    Get Custom Slides by Experts
    Instantly Access Templates in PowerPoint

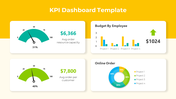
    Excellent KPI Dashboard Template

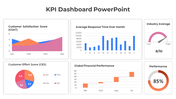
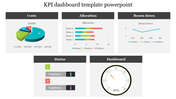
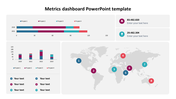
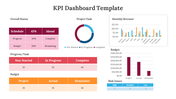
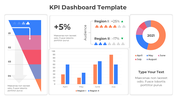
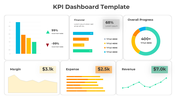
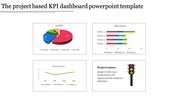
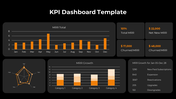
    Monitoring your KPIs and adjusting as needed is necessary for running your business effectively. Download our KPI templates, then use them to build a visual depiction of your company's goals and objectives to simplify your life. The provided dashboard's pie charts and readings make it simple to display milestones you hope to reach within a specific time frame. Using the six nodes, you can easily describe anything to your heart's content. Grab it to create a presentation with a professional appearance easily.

    Features of the template

    • 100 % customizable slides and easy to download.
    • Slides are available in different nodes & colors.
    • The Slide contained 16:9 and 4:3 formats.
    • Easy to change the slide colors quickly.
    • It is a well-crafted template with an instant download facility.
    • It is designed with a stunning theme design.
    • Best template for KPI presentations.
    Advertisement

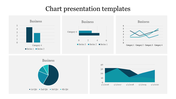
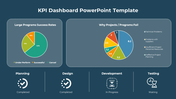
    You May Also Like These PowerPoint Templates

    Free
    Add to Wishlist
    Download
    AI Customize
    Speedometer graphic with a blue progress bar, labeled distance values, and a right-side text box explaining its concept.
    Free
    Add to Wishlist
    Download
    AI Customize
    Line chart template with three data series in blue, teal, black, and text sections.
    Add to Wishlist
    Download
    AI Customize
    Chart PPT template with bar graphs showing clicks and recipients, a pie chart for email categories, and a line graph.
    Add to Wishlist
    Download
    AI Customize
    Gradient-styled horizontal bar chart with blue and green bars, labeled text areas, and a light blue background.
    Add to Wishlist
    Download
    AI Customize
    Bar chart with four vertical orange columns, gray numbered tops, captions, and a dollar sign axis on a white background.
    Free
    Add to Wishlist
    Download
    AI Customize
    Bubble chart on the right with varying circle sizes and a dark blue section on the left featuring three headings and text.
    Add to Wishlist
    Download
    AI Customize
    Chart presentation template displaying monthly data for Visitors, New Customers, and Leads with bar and line charts.
    Add to Wishlist
    Download
    AI Customize
    Amazing PowerPoint Dashboard Presentation Template
    Add to Wishlist
    Download
    AI Customize
    Circular tachometer gauge with a needle pointing six colored sections, and captions in rounded rectangles connected by lines.
    Add to Wishlist
    Download
    AI Customize
    Versatile PowerPoint Chart Templates for Data Insights
    Add to Wishlist
    Download
    AI Customize
    Horizontal bar chart with three color-coded series, labeled values, and a left side legend with numbered captions.
    Free
    Add to Wishlist
    Download
    AI Customize
    Circular gauge style infographic in shades of gray, showing a speedometer with a needle and distance markers.
    Add to Wishlist
    Download
    AI Customize
    A tachometer PowerPoint template with five dials in different colors, each representing a specific section with captions.
    Add to Wishlist
    Download
    AI Customize
    Slide deck with multiple circular progress bars in various colors, showing percentages and captions below.
    Add to Wishlist
    Download
    AI Customize
    Slide with a horizontal bar chart on the left and 3D cylindrical percentage charts in blue, green, and teal, on the right.