The Best KPI Dashboard PPT And Google Slides Template

PowerPoint slide with KPI dashboard metrics, including revenue, sales by month, and customer revenue comparison.
P.ID : 2127
    2.4K+ views
    359 Downloads
    Get Custom Slides by Experts
    Instantly Access Templates in PowerPoint

    KPI Dashboard PowerPoint Template


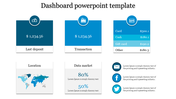
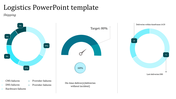
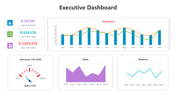
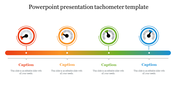
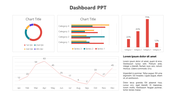
    A KPI dashboard visually displays key performance indicators, offering real-time insights into business performance. It enables stakeholders to track progress, identify trends, and make data-driven decisions to optimize organizational effectiveness. Tailored for professionals across industries, our KPI Dashboard PowerPoint template is an essential tool for monitoring and analyzing performance metrics. From executives and managers to analysts and consultants, anyone involved in decision-making can benefit from this template. The fully editable slides enable customization to suit specific business needs and preferences. This template offers six options and includes editable graphs and charts, featuring a cohesive blue color theme throughout. With clear visualizations and concise data presentation, this template facilitates better understanding and communication of KPIs. Empower your team to drive performance improvements and achieve organizational goals effectively. Download now and harness the power of data-driven insights to propel your success.

    Features of this template


    • 100% customizable slides and easy to download.
    • The slide contains 16:9 and 4:3 formats.
    • Easy to change the colors of the slide quickly.
    • Highly compatible with PowerPoint and Google Slides.
    Advertisement

    You May Also Like These PowerPoint Templates

    Add to Wishlist
    Download
    AI Customize
    Executive dashboard slide with a gauge displaying performance across different levels, labeled three sections.
    Add to Wishlist
    Download
    AI Customize
    Slide with a businesswoman standing beside a colorful ring chart labeled on a board and four captions on the right.
    Add to Wishlist
    Download
    AI Customize
    Marketing KPI template with three circular icons, and bar and line charts in blue, gray, and green below.
    Add to Wishlist
    Download
    AI Customize
    Best Elegant Tachometer Presentation Download Template
    Free
    Add to Wishlist
    Download
    AI Customize
    Circular speedometer design with a red progress arc from 5.5 to 6.5 KM, and a gray caption box for customizable text content.
    Add to Wishlist
    Download
    AI Customize
    Speedometer style dashboard template with green, yellow, and red zones for progress tracking with captions.
    Add to Wishlist
    Download
    AI Customize
    Dashboard layout showing net worth value, asset categories in a pie chart, and bar chart for real estate comparisons.
    Add to Wishlist
    Download
    AI Customize
    Slide showcasing data visualizations using donut, bar, column, line charts, and a text box, using yellow highlights.
    Add to Wishlist
    Download
    AI Customize
    Business dashboard slide with a monitor displaying charts and graphs, paired with four colored icons and captions.
    Add to Wishlist
    Download
    AI Customize
    Slide design featuring three green speedometer graphics displaying different progress levels, each paired with a caption.
    Add to Wishlist
    Download
    AI Customize
    Sales performance dashboard with four circular progress charts in orange, blue, purple, and green, showing percentage values.
    Add to Wishlist
    Download
    AI Customize
    Project dashboard slide with a compass design,  featuring four labeled captions, and an orange sidebar for text.
    Add to Wishlist
    Download
    AI Customize
    Dashboard slide featuring six sections with graphs and metrics for annual performance in blue and green.
    Add to Wishlist
    Download
    AI Customize
    Effective Dashboard PowerPoint Templates Design
    Add to Wishlist
    Download
    AI Customize
    Dashboard slide featuring a stacked bar chart in red, green, and purple, and two speedometer gauge indicators below.
    Add to Wishlist
    Download
    AI Customize
    Dashboard slide with a circular chart in blue shades, featuring percentage labels, and five icons with text on the right.
    Add to Wishlist
    Download
    AI Customize
    Dashboard slide with a pie chart, stacked area chart, and multiple colored rectangular boxes displaying metrics.