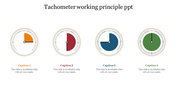
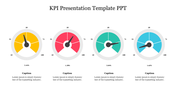
Affordable Chart PPT Presentation Template Slide-Four Node

Dashboard with four green-themed charts bar graph, pie chart, horizontal bar chart, and area graph showing monthly data.
P.ID : 4160
    425 views
    34 Downloads
    Get Custom Slides by Experts
    Instantly Access Templates in PowerPoint

    Editable Chart PPT Template

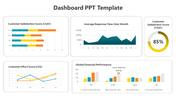
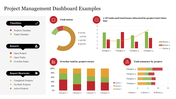
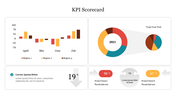
    Does your presentation fall flat, leaving your audience disengaged and unmotivated? Don't be afraid! Our carefully crafted Dashboard Chart PPT is here to transform your story using data. Let’s dive into the details:
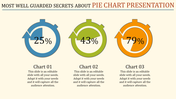
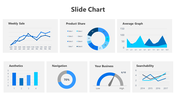
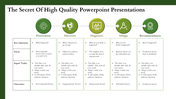
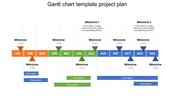
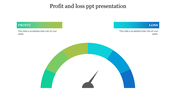
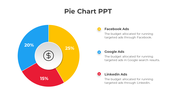
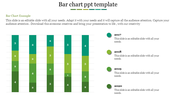
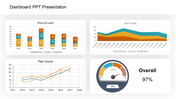
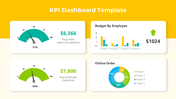
    Four chart types and one value: bar graphs, pie charts, horizontal bars, and area charts—all coexist in harmony. Each system whispers insight, turning random numbers into compelling stories. The color green is not desirable; This has been well thought out. It guides the eye to important data points, ensuring clarity.
    Customization at your fingertips: Adjust, tweak, and customize—make it your own.
    Executives, analysts, marketers—anyone walking through boardrooms or virtual meetings. This template simplifies complex information, making your message clearer.
     Click on that download button. Find these templates with Google Slides Themes. Turn your next presentation into a bridge that connects data to decisions.

    Features of the template:

    •  Slides are available in 4:3 & 16:9
    • Well-crafted template with instant download.
    • Get slides that are 100% customizable and easy to download
    Advertisement

    You May Also Like These PowerPoint Templates

    Add to Wishlist
    Download
    AI Customize
    Three pie charts in brown, blue, and green sections, each with labeled percentages and caption lines.
    Free
    Add to Wishlist
    Download
    AI Customize
    Multicolored circular pie chart in yellow, red, and green, with labeled categories listed on the right.
    Add to Wishlist
    Download
    AI Customize
    Seven rectangular sections with financial data on top and visual charts below, bordered in blue with organized text.
    Add to Wishlist
    Download
    AI Customize
    Customer Service PowerPoint Slide for Effective Service
    Add to Wishlist
    Download
    AI Customize
    Speedometer graphic with six sections from green to red color gradient, each with icons and text areas.
    Add to Wishlist
    Download
    AI Customize
    Semi circular meter template with green, lime, yellow, and red sections, each displaying thumbs up icons, and text.
    Free
    Add to Wishlist
    Download
    AI Customize
    Effective Speedometer PowerPoint Template Presentation
    Add to Wishlist
    Download
    AI Customize
    Executive dashboard with a portfolio summary table listing project details and a pie chart displaying a quarterly report.
    Add to Wishlist
    Download
    AI Customize
    Dashboard template showing main categories, team metrics, and performance details with various visual elements.
    Add to Wishlist
    Download
    AI Customize
    Tachometer slide featuring a dial with a needle pointing to colored segments and four caption areas.
    Add to Wishlist
    Download
    AI Customize
    Set of three speedometer gauges indicating 70%, 50%, and 55%, with placeholder text areas placed in a white backdrop.
    Add to Wishlist
    Download
    AI Customize
    Central black speedometer with four surrounding colored icons, each detailing various aspects of kilometers.
    Add to Wishlist
    Download
    AI Customize
    Dashboard template showing a line chart of page likes over months with marked events in June and August.
    Add to Wishlist
    Download
    AI Customize
    Executive dashboard slide with a colorful line chart for yearly performance.
    Add to Wishlist
    Download
    AI Customize
    Dashboard Model PowerPoint slide showing statistics, graphs, and icons representing business data analysis.
    Add to Wishlist
    Download
    AI Customize
    Dashboard slide with six gauge meters displaying low to high ranges, each labeled with captions below.
    Add to Wishlist
    Download
    AI Customize
    Circular tachometer design with a central gauge and surrounding colored segments, each linked to captions on the right.