Profit And Loss PPT Presentation Template & Google Slides

Slide displaying a profit and loss presentation with a colorful gauge in the center, indicating profit and loss levels.
P.ID : 49428
    439 views
    42 Downloads
    Get Custom Slides by Experts
    Instantly Access Templates in PowerPoint

    Best Profit And Loss Template For Presentation

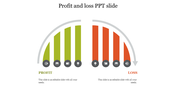
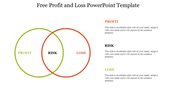
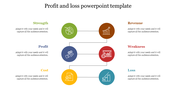
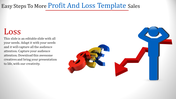
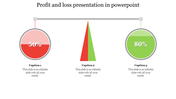
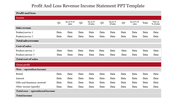
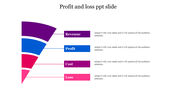
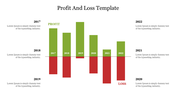
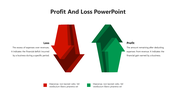
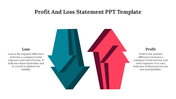
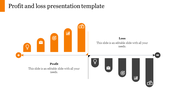
    Profit and Loss is a common issue that happens in businesses. Having pre-planned profit tactics will boost the business process. Make your income smooth by checking your profit and Loss with our latest profit and loss presentation template. It is designed with simple designs, color tones, and titles to make your work informative. Additionally, the template designs like icons, background tones, and shapes can be customized to improve your presentation skills. Use this creative layout in your profit and loss presentation and add more revenue to your business. Grab It!!

    Features of the template

    • 100 % customizable slides and easy to download.
    • Slides are available in different colors
    • The slide has 4:3 and 16:9 formats.
    • Easy to change the slide colors quickly.
    • Appealing presentation to impress an audience
    • Create feature-rich slide presentations. 
    • Eye-pleasing designs to impress the audience.
    Advertisement

    You May Also Like These PowerPoint Templates

    Add to Wishlist
    Download
    AI Customize
    Sentiment meter infographic displaying six emotions in a colorful fan design, each labeled with placeholders text areas.
    Add to Wishlist
    Download
    AI Customize
    KPI Dashboard PowerPoint template displaying key metrics, including count of contracts, revenues, and costs.
    Add to Wishlist
    Download
    AI Customize
    Tachometer template with percentage markers and color-coded designs, each paired with caption areas.
    Add to Wishlist
    Download
    AI Customize
    Executive dashboard template showcasing growth, progress, and performance metrics for effective management.
    Add to Wishlist
    Download
    AI Customize
    KPI slide showcasing cash flow metrics and financial performance over six months in different bar chat layouts.
    Add to Wishlist
    Download
    AI Customize
    Amazing Dashboard PowerPoint Template And Google Slides
    Add to Wishlist
    Download
    AI Customize
    Dashboard slide with two green gauge meters, each labeled with a caption and text below.
    Add to Wishlist
    Download
    AI Customize
    Editable KPI Dashboard PowerPoint And Google Slides
    Add to Wishlist
    Download
    AI Customize
    Microsoft dashboard slide showcasing supply chain costs, inventory to sales ratio, and carrying cost of inventory.
    Add to Wishlist
    Download
    AI Customize
    PowerPoint slide featuring a project dashboard with bar charts and a pie chart displaying project data and progress.
    Add to Wishlist
    Download
    AI Customize
    Project status dashboard slide displaying budgets and performance metrics for banners, social media, and brochures.
    Add to Wishlist
    Download
    AI Customize
    PowerPoint slide with a tachometer graphic showing numbers 1 through 8 in different colors, with placeholders for captions.
    Add to Wishlist
    Download
    AI Customize
    Colorful tachometer PowerPoint slide design with transportation icons including airplane, car, bus, and train with captions.
    Add to Wishlist
    Download
    AI Customize
    Ten speedometer icons in two rows, each with blue, green, and red segments, ranging from 0 to 100.
    Free
    Add to Wishlist
    Download
    AI Customize
    Six charts in different formats, including line, pie, bar, and gauge, all in blue and gray, displaying data trends.
    Add to Wishlist
    Download
    AI Customize
    Project management dashboard slide showing colored charts for net worth, sector allocation, and various financial metrics.
    Add to Wishlist
    Download
    AI Customize
    Tachometer slide with four gauges in orange, red, blue, and green, each with captions below describing different readings.
    Add to Wishlist
    Download
    AI Customize
    Dashboard with bar charts, line graphs, and a gauge chart in various colors and a percentage indicator, on white background.