Profit And Loss PowerPoint Presentation And Google Slides

Profit And Loss PowerPoint Slide
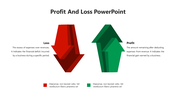
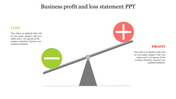
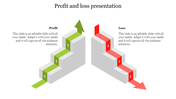
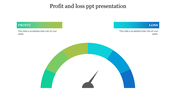
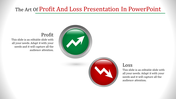
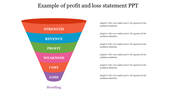
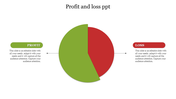
Profit and loss, commonly referred to as P&L, encapsulates the financial health of a business by detailing its revenues, expenses, and overall profitability within a specified timeframe. It serves as a vital tool for evaluating the operational efficiency and performance of a company. Essentially, the P&L statement allows stakeholders to gauge the success of a business in generating revenue and managing costs, thereby influencing strategic decision-making processes. Our Profit and Loss PowerPoint template empowers users to effectively present financial data in a clear and concise manner. Tailored for business owners, financial analysts, and managers, this template streamlines the visualization of intricate financial information. Featuring editable slides, it offers flexibility for customization, enabling users to adapt the presentation to their specific needs, including adjusting colors, incorporating company branding, and modifying content. With its user-friendly design and intuitive layout, this template facilitates the seamless communication of financial performance metrics and strategic insights. By leveraging this template, presenters can enhance audience comprehension, facilitate data-driven decision-making, and ultimately drive business growth and profitability. Encourage your audience to utilize this template as a powerful tool for streamlining financial presentations and conveying essential information with clarity and impact, thus empowering them to make informed decisions and achieve organizational objectives.
Features of this template
- 100% customizable slides and easy to download.
- Slides are available in different nodes & colors.
- The slide contains 16:9 and 4:3 formats.
- Easy to change the colors of the slide quickly.
- Highly compatible with PowerPoint and Google Slides.
- Well-crafted template with an instant download facility.


You May Also Like These PowerPoint Templates
Add to Wishlist
Download
AI Customize


Add to Wishlist
Download
AI Customize

Add to Wishlist
Download
AI Customize

Add to Wishlist
Download
AI Customize

Add to Wishlist
Download
AI Customize

Add to Wishlist
Download
AI Customize

Add to Wishlist
Download
AI Customize

Add to Wishlist
Download
AI Customize

Add to Wishlist
Download
AI Customize

Add to Wishlist
Download
AI Customize

Add to Wishlist
Download
AI Customize

Add to Wishlist
Download
AI Customize

Free
Add to Wishlist
Download
AI Customize

Add to Wishlist
Download
AI Customize

Add to Wishlist
Download
AI Customize

Add to Wishlist
Download
AI Customize

Add to Wishlist
Download
AI Customize

Add to Wishlist
Download
AI Customize

Add to Wishlist
Download
AI Customize
