Innovative Profit And Loss Statement Template Presentation

Company profit and loss graph slide showing growth in profit and steady loss decline from 2015 to 2019.
P.ID : 32038
    547 views
    27 Downloads
    Get Custom Slides by Experts
    Instantly Access Templates in PowerPoint

    Profit and Loss Statement Template and Google Slides


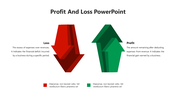
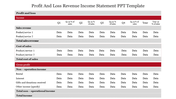
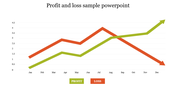
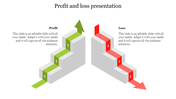
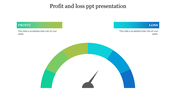
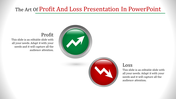
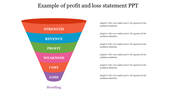
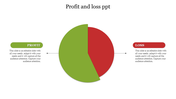
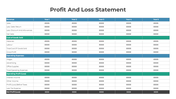
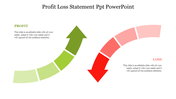
    Unlock the power of financial visualization with our meticulously crafted Profit and Loss Statement PPT template. Tailored for business presentations, this template seamlessly integrates statistics design, boasting a visually compelling layout with four strategically placed nodes. The sleek and professional shades of color not only enhance aesthetic appeal but also lend an air of sophistication to your creative presentation. Ideal for both analytical scrutiny and business communication, this Income Statement Template provides a dynamic visual representation of your financial data. Elevate your presentations with this tool, as it effortlessly combines practicality with a design that speaks volumes in the corporate realm, making it an invaluable asset for effective and impactful financial storytelling.

    Features of the template

    • 100% customizable slides and easy to download.
    • Slides are available in different nodes & colors.
    • The slides contain 16:9 and 4:3 formats.
    • Easy to change the colors quickly.
    • It is a well-crafted template with an instant download facility.
    • Compatible with Google Slides and PowerPoint.
    Advertisement

    You May Also Like These PowerPoint Templates

    Add to Wishlist
    Download
    AI Customize
    Profit and loss arrows, with sections for inventory management, marketing campaigns, cost reduction, and revenue strategies.
    Free
    Add to Wishlist
    Download
    AI Customize
    Diagram with two circular sections 55% profit in pink and 45% loss in blue, each with caption areas.
    Add to Wishlist
    Download
    AI Customize
    Two large arrows, green pointing right for profit and red pointing left for loss, with text placeholder inside.
    Add to Wishlist
    Download
    AI Customize
    Semi circular bar chart with green profit bars on the left and red loss bars on the right, each linked to an icon below.
    Add to Wishlist
    Download
    AI Customize
    Flow diagram for a loss aversion example, with steps highlighted by yellow, red, and green shapes connected by arrows.
    Add to Wishlist
    Download
    AI Customize
    Effective Profit And Loss Template Presentation-Two Node
    Add to Wishlist
    Download
    AI Customize
    Profit and loss presentation in powerpoint slide
    Add to Wishlist
    Download
    AI Customize
    Profit and loss chart showing six vertical green and red bars, with labeled years from 2017 to 2022, on a white background.
    Add to Wishlist
    Download
    AI Customize
    Profit and loss PowerPoint template showing a person with hands on head and falling currency symbols.
    Add to Wishlist
    Download
    AI Customize
    Profit-loss infographic with a traditional scale, visually emphasizing a larger loss compared to a smaller profit.
    Add to Wishlist
    Download
    AI Customize
    Profit and loss statement PPT template featuring two business figures, percentage arrows, and icons with captions.
    Free
    Add to Wishlist
    Download
    AI Customize
    Semi circular gauge with four sections in green, blue, orange, and pink, labeled 01 to 04, with a pointer in the center
    Add to Wishlist
    Download
    AI Customize
    Profit and loss color coded bar chart slide depicting financial trends of a business over six years with placeholder text.
    Add to Wishlist
    Download
    AI Customize
    A slide showing profit and loss analysis with icons representing strength, revenue, profit, weakness, cost, and loss.
    Add to Wishlist
    Download
    AI Customize
    Slide with two arrows pointing up and down in red and teal, highlighting financial concepts side by side.
    Add to Wishlist
    Download
    AI Customize
    Illustration of a scale balancing profit and loss, represented by red and green circles labeled accordingly.