Excellent Profit And Loss PowerPoint Template

A slide showing profit and loss analysis with icons representing strength, revenue, profit, weakness, cost, and loss.
P.ID : 49437
    568 views
    42 Downloads
    Get Custom Slides by Experts
    Instantly Access Templates in PowerPoint

    Creative Profit And Loss Analysis PowerPoint Template

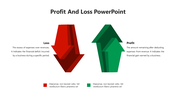
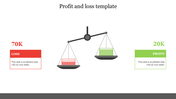
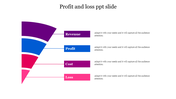
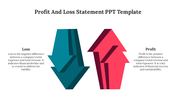
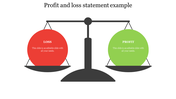
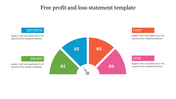
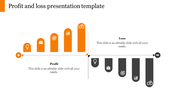
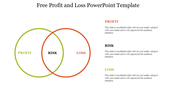
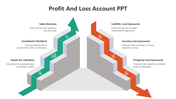
    A profit and loss report is a financial statement that outlines the revenues, costs, and expenses. Do you want to explain the profit and loss of your business? Get our Profit And Loss PowerPoint Template to weigh the profit and loss, giving the expected profits and focusing on enactment. This PPT is mainly used in business strategy meetings or company marketing meetings. It is a pre-built slide with all the essential features you can record revenue and expenses. In addition, the six icon designs of this PowerPoint help to explain the profit and loss to the audience. In addition, this PowerPoint has six captions in which users can add their reports. In addition, Users can select any Analysis PPT slide for their needs.

    Feature of the template   

    • 100% customizable slides and easy to download.
    • Slides are available in different nodes & colors.
    • The slide is contained in 16:9 and 4:3 formats.
    • Easy to change the slide colors quickly.
    • Well-crafted template with instant download facility. 
    • It is a well-designed presentation template.
    • Best template for creative presentation.
    Advertisement

    You May Also Like These PowerPoint Templates

    Add to Wishlist
    Download
    AI Customize
    Balance scale with a green minus sign representing loss and a red plus sign representing profit on opposite ends.
    Add to Wishlist
    Download
    AI Customize
    Loss aversion psychology slide with two contrasting boxes one for pain from loss and another for pleasure from gain.
    Add to Wishlist
    Download
    AI Customize
    A line chart comparing profit and loss trends over the year, with a green upward and red downward, intersecting mid year.
    Add to Wishlist
    Download
    AI Customize
    Dual staircase diagram representing profit and loss, with placeholder text areas beside each staircase.
    Add to Wishlist
    Download
    AI Customize
    Slide design for profit and loss presentations with icons for profit in green and loss in red, offering text options.
    Add to Wishlist
    Download
    AI Customize
    Profit and loss statement slide with a funnel diagram showing levels from strength, revenue, profit, weakness, cost, to loss.
    Add to Wishlist
    Download
    AI Customize
    Profit and loss slide with a green and red pie chart in the center, and labeled sections with descriptive text on each side.
    Add to Wishlist
    Download
    AI Customize
    Create Profit And Loss Statement PPT And Google Slides
    Add to Wishlist
    Download
    AI Customize
    Profit loss statement featuring green arrows for profit and red arrows for loss with placeholder text.
    Add to Wishlist
    Download
    AI Customize
    Profit and loss arrows, with sections for inventory management, marketing campaigns, cost reduction, and revenue strategies.
    Free
    Add to Wishlist
    Download
    AI Customize
    Diagram with two circular sections 55% profit in pink and 45% loss in blue, each with caption areas.
    Add to Wishlist
    Download
    AI Customize
    Two large arrows, green pointing right for profit and red pointing left for loss, with text placeholder inside.
    Add to Wishlist
    Download
    AI Customize
    Semi circular bar chart with green profit bars on the left and red loss bars on the right, each linked to an icon below.
    Add to Wishlist
    Download
    AI Customize
    Flow diagram for a loss aversion example, with steps highlighted by yellow, red, and green shapes connected by arrows.
    Add to Wishlist
    Download
    AI Customize
    Effective Profit And Loss Template Presentation-Two Node
    Add to Wishlist
    Download
    AI Customize
    Profit and loss chart showing six vertical green and red bars, with labeled years from 2017 to 2022, on a white background.