Two Node Profit And Loss Presentation In PowerPoint and Google slides

Slide with red and green thermometers representing loss and profit, and a money stack graphic on the left.
P.ID : 7995
    645 views
    37 Downloads
    Get Custom Slides by Experts
    Instantly Access Templates in PowerPoint

    Editable Profit and Loss presentation in PPT template


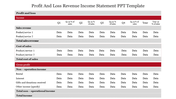
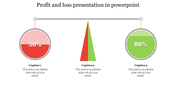
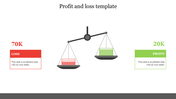
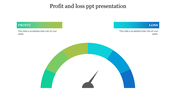
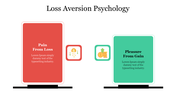
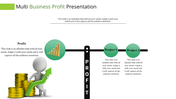
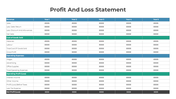
    Showing your company's finances just got easier! This downloadable template helps you build clear profit and loss presentations for PowerPoint and Google Slides.  It has two separate sections: one for your income (money coming in) and expenses (money going out).  Each section lets you add titles, labels, and details to explain your company's financial health.
    Great for business owners, managers, and anyone presenting finances, this template saves you design time. Just fill in the premade sections with your numbers, add charts or graphs if you want, and you've got a presentation that keeps everyone informed.  Focus on sharing key financial details, not fancy slides. Download this presentation template today and make presentations that guide smart business choices.

    Features of the template


    • 100% customizable slides and easy to download.
    • The slides contain 16:9 and 4:3 formats.
    • Easy to change the colors quickly.
    • It is a well-crafted template with an instant download facility.
    • It is a 100% pre-designed slide.
    • The slide holds vibrant colors.
    Advertisement

    You May Also Like These PowerPoint Templates

    Add to Wishlist
    Download
    AI Customize
    A Profit and Loss slide showing two arrows a red downward arrow labeled and a green upward arrow with descriptions.
    Free
    Add to Wishlist
    Download
    AI Customize
    Diagram with two circular sections 55% profit in pink and 45% loss in blue, each with caption areas.
    Add to Wishlist
    Download
    AI Customize
    Two large arrows, green pointing right for profit and red pointing left for loss, with text placeholder inside.
    Add to Wishlist
    Download
    AI Customize
    Semi circular bar chart with green profit bars on the left and red loss bars on the right, each linked to an icon below.
    Add to Wishlist
    Download
    AI Customize
    Flow diagram for a loss aversion example, with steps highlighted by yellow, red, and green shapes connected by arrows.
    Add to Wishlist
    Download
    AI Customize
    Effective Profit And Loss Template Presentation-Two Node
    Add to Wishlist
    Download
    AI Customize
    Profit and loss chart showing six vertical green and red bars, with labeled years from 2017 to 2022, on a white background.
    Add to Wishlist
    Download
    AI Customize
    Profit and loss PowerPoint template showing a person with hands on head and falling currency symbols.
    Add to Wishlist
    Download
    AI Customize
    Profit and loss statement PPT template featuring two business figures, percentage arrows, and icons with captions.
    Free
    Add to Wishlist
    Download
    AI Customize
    Semi circular gauge with four sections in green, blue, orange, and pink, labeled 01 to 04, with a pointer in the center
    Add to Wishlist
    Download
    AI Customize
    Profit and loss color coded bar chart slide depicting financial trends of a business over six years with placeholder text.
    Add to Wishlist
    Download
    AI Customize
    A slide showing profit and loss analysis with icons representing strength, revenue, profit, weakness, cost, and loss.
    Add to Wishlist
    Download
    AI Customize
    Slide with two arrows pointing up and down in red and teal, highlighting financial concepts side by side.
    Add to Wishlist
    Download
    AI Customize
    Slide showing a profit and loss chart with orange and inverted gray bars, each containing icons, on a white background.
    Free
    Add to Wishlist
    Download
    AI Customize
    Free Profit and Loss PowerPoint Template and Google Slides
    Add to Wishlist
    Download
    AI Customize
    Profit and loss slide with green upward and red downward arrows on 3D stairs, linked to financial terms and icons.
    Add to Wishlist
    Download
    AI Customize
    Balance scale with a green minus sign representing loss and a red plus sign representing profit on opposite ends.