Creative KPI Scorecard PowerPoint Template Slide PPT

Visual KPI layout with performance bar chart, doughnut chart, and percentage indicators for project analysis.
P.ID : 66736
    332 views
    44 Downloads
    Get Custom Slides by Experts
    Instantly Access Templates in PowerPoint

    Innovative KPI Scorecard PowerPoint Template PPT


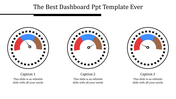
    Get this KPI scorecard slide is a term used to describe the statistical record measures achievement towards the KPI performance indicator. It helps the decision-makers to gain an overview of the complete performance scorecard. Try this slide to measure the success or failure of achieving a particular goal.

    About the template:

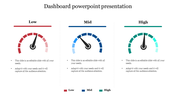
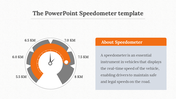
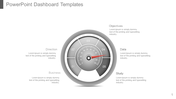
    Grab this KPI scorecard template with a white background that gives a brighter look while you present placing texts and images. The template contains various graphical presentations in various colors to show the difference. And the template has editable texts for you to add additional information. Customize the slide with various features provided by SlideEgg.

    Download this scorecard slide for the creative presentation to make the audience understand the performance. And visit our professional PowerPoint templates site from SlideEgg.

    Features of the slide:

    1.100% customizable slides and easy to download.
    2. Slides available in different nodes & colors.
    3. The slides contained 16:9 and 4:3 formats.
    4. Easy to change the slide colors quickly.
    5. Well-crafted template with instant download facility.
    6. The creative scorecard template for the PPT presentation.
    Advertisement

    You May Also Like These PowerPoint Templates

    Add to Wishlist
    Download
    AI Customize
    Slide with pie charts, line graphs, and a bar chart in shades of green, illustrating data trends and comparisons.
    Add to Wishlist
    Download
    AI Customize
    Speedometer slide with three colorful gauges showing percentages each with captions.
    Add to Wishlist
    Download
    AI Customize
    Dashboard with a red line graph for Jan-May and a bar chart of four colored percentage bars and category icons.
    Free
    Add to Wishlist
    Download
    AI Customize
    PowerPoint slide showcasing projected cash flows, NPV for 3 and 5 years, and payback period with client testimonial.
    Free
    Add to Wishlist
    Download
    AI Customize
    Infographic of a bar chart representing yearly growth from 2018 to 2021 with a businesswoman illustration.
    Add to Wishlist
    Download
    AI Customize
    Three panel dashboard with column, bar, and funnel charts at the top and numbered blue boxes with text below.
    Free
    Add to Wishlist
    Download
    AI Customize
    3D bar chart PowerPoint template showcasing data in four colored categories with a highlight and captions.
    Free
    Add to Wishlist
    Download
    AI Customize
    Dashboard with line chart for appointments, bar chart from hospital earnings to patient totals, and intake by category.
    Add to Wishlist
    Download
    AI Customize
    Slide deck of energy dashboards displaying data visualizations like pie charts, bar and line graphs, in green shades.
    Free
    Add to Wishlist
    Download
    AI Customize
    KPI dashboard layout with blue semicircle gauges and line charts representing social media performance metrics.
    Free
    Add to Wishlist
    Download
    AI Customize
    Dashboard layout with three semicircular gauges in orange and brown tones, paired with captions, on a beige background.
    Free
    Add to Wishlist
    Download
    AI Customize
    Horizontal chart with dual color bars in green and blue, displaying percentage values, and two captions on the right.
    Add to Wishlist
    Download
    AI Customize
    Four colored circular progress, one is higlighted in a box with a pie chart, and a bar chart labelled with sections.
    Add to Wishlist
    Download
    AI Customize
    Key performance indicator slide displaying data bars, percentages, and distinct icons in a structured layout.
    Add to Wishlist
    Download
    AI Customize
    Comprehensive program dashboard featuring charts and gauges for quality, budget, risks, overall project map, progress, and resource updates.
    Free
    Add to Wishlist
    Download
    AI Customize
    Four black speedometers with white numbers and yellow markers arranged in a two by two grid with descriptions.
    Add to Wishlist
    Download
    AI Customize
    KPI infographic slide deck, combining line and bar graphs,  pie charts, and performance dials for data representation.