Explore Speedometer PowerPoint Template And Google Slides

Speedometer graphic with six sections from green to red color gradient, each with icons and text areas.
P.ID : 7380
    714 views
    97 Downloads
    Get Custom Slides by Experts
    Instantly Access Templates in PowerPoint

    Editable Speedometer PowerPoint Template


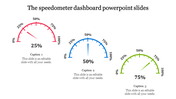
    Delve into a dynamic journey with the Speedometer, a versatile metaphor encapsulating key organizational concepts like Objectives, Planning, Execution, Communication, and Monitoring. Much like a speedometer guides a vehicle's performance, this concept steers organizational success, where objectives set the course, planning charts the route, execution propels forward, communication aligns efforts, and monitoring ensures adaptive progress. Tailored for goal-oriented professionals and strategic planners, the PowerPoint template features 6 nodes and a vibrant multicolor theme, incorporating a Speedometer design. Its fully editable slides enable seamless customization, aligning with specific objectives and enhancing visual appeal. The template serves as a powerful visual aid, fostering engagement and comprehension. Particularly useful for presenting and monitoring progress toward goals, it empowers presenters to effectively communicate objectives, plans, and progress. Encourage your audience to leverage this template, harnessing its dynamic design and adaptability to steer their presentations with precision, ensuring impactful communication and fostering a shared understanding of organizational velocity and success. As a valuable resource, it facilitates a visual representation of strategic acceleration, guiding presenters toward goal attainment and elevating the overall impact of their presentations.

    Features of this template


    • 100% customizable slides and easy to download.
    • Slides are available in different nodes & colors.
    • The slide contained 16:9 and 4:3 formats.
    • Easy to change the slide colors quickly.
    • It is a well-crafted template with an instant download facility.
    Advertisement

    You May Also Like These PowerPoint Templates

    Add to Wishlist
    Download
    AI Customize
    Chart PPT template showing 4 progress circles with percentages and color coded sections for Blue, Green, Yellow, and Orange.
    Free
    Add to Wishlist
    Download
    AI Customize
    Executive dashboard slide with five numbered circular icons on dark blue shapes, each labeled with key principles.
    Add to Wishlist
    Download
    AI Customize
    Dashboard layout with bar, pie, and stacked charts in yellow, orange, red, and green on a white background.
    Add to Wishlist
    Download
    AI Customize
    Infographic featuring pie graph, horizontal and vertical bar charts for visualizing data trends and comparisons.
    Add to Wishlist
    Download
    AI Customize
    Executive slide showing expense meters, world sales performance, and bar graphs for margin, expenses, and revenue by month.
    Add to Wishlist
    Download
    AI Customize
    KPI template displaying financial metrics, including sales, profitability, liquidity, and leverage, with two gauge charts.
    Add to Wishlist
    Download
    AI Customize
    Executive dashboard slide with a pie chart, bar graph, area chart, and a profile section for job title and details.
    Add to Wishlist
    Download
    AI Customize
    KPI dashboard template PowerPoint slide featuring three sections for data visualization.
    Add to Wishlist
    Download
    AI Customize
    Dashboard layout including a bar chart of company data, a pie chart for quarterly sales distribution.
    Add to Wishlist
    Download
    AI Customize
    KPI template with three gauges displaying progress levels for sales, production, and downloads.
    Add to Wishlist
    Download
    AI Customize
    Dashboard gauges with red, yellow, green indicators showing low, medium, high performance against a gray background.
    Free
    Add to Wishlist
    Download
    AI Customize
    Pie chart in orange, red, green, and blue sections with two text labels on either side, highlighting sales performance.
    Add to Wishlist
    Download
    AI Customize
    A dashboard PPT slide with bar charts for Zantedeschia, Celosia, and Calendula, and three colorful gauge indicators.
    Add to Wishlist
    Download
    AI Customize
    Attractive PowerPoint KPI Dashboard Presentation Template
    Add to Wishlist
    Download
    AI Customize
    Dashboard presentation slide with a line chart trend and circular charts highlighting project progress percentages.
    Add to Wishlist
    Download
    AI Customize
    Dashboard gauge chart PPT template with color coded sections for big loss, loss, break even, profit, and high profit.
    Add to Wishlist
    Download
    AI Customize
    Internet speed dashboard featuring two routers with speed performance indicators and mobile phones.