MILESTONE 🌟 5 Million+ creative minds trust SlideEgg! Grab 80% OFF

Our Predesigned Project Dashboard PowerPoint Template

Comprehensive project dashboard template with progress charts, data bars, and financial performance indicators.
P.ID : 41730
    1.6K+ views
    234 Downloads
    Get Custom Slides by Experts
    Instantly Access Templates in PowerPoint

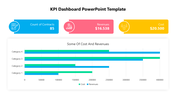
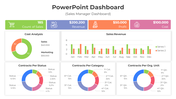
    Professional Project Dashboard Slide

    Now displaying the metrics, insights, stats, and KPIs related to your projects is simple with our Project Dashboard PowerPoint Template. This effective tool can help you visualize and monitor the performance of your projects to optimize and enhance them. It has a perfectly designed dashboard with well-made, editable charts to communicate the KPIs. The clear and understandable layout of this slide will make your presentations easily digestible to your audience. You can also easily revamp its elements to meet your project needs. Give it a whirl!

    Features of the template

    • 100% customizable slides and easy to download.
    • Slides are available in different nodes & colors.
    • The slide contains 16:9 and 4:3 formats.
    • Easy to change the colors of the slide quickly.
    • Well-crafted template with an instant download facility.
    • Perfect-looking dashboard slide.
    • Highly compatible with PowerPoint, Google Slides and Canva templates
    Advertisement

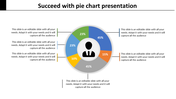
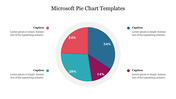
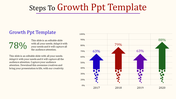
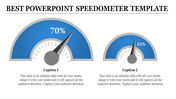
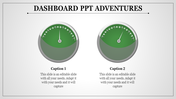
    You May Also Like These PowerPoint Templates

    Add to Wishlist
    Download
    AI Customize
    Slide showcasing four circular progress charts with percentages in alternating teal and black accents.
    Add to Wishlist
    Download
    AI Customize
    Editable KPI Dashboard PowerPoint And Google Slides
    Add to Wishlist
    Download
    AI Customize
    Microsoft dashboard slide showcasing supply chain costs, inventory to sales ratio, and carrying cost of inventory.
    Add to Wishlist
    Download
    AI Customize
    PowerPoint slide featuring a project dashboard with bar charts and a pie chart displaying project data and progress.
    Add to Wishlist
    Download
    AI Customize
    Project status dashboard slide displaying budgets and performance metrics for banners, social media, and brochures.
    Add to Wishlist
    Download
    AI Customize
    PowerPoint slide with a tachometer graphic showing numbers 1 through 8 in different colors, with placeholders for captions.
    Add to Wishlist
    Download
    AI Customize
    Pie chart highlighting percentages for four steps with a caption areas in a circular layout placed in a grey backdrop.
    Add to Wishlist
    Download
    AI Customize
    Colorful tachometer PowerPoint slide design with transportation icons including airplane, car, bus, and train with captions.
    Add to Wishlist
    Download
    AI Customize
    Ten speedometer icons in two rows, each with blue, green, and red segments, ranging from 0 to 100.
    Free
    Add to Wishlist
    Download
    AI Customize
    A slide showing a colorful KWL chart with sections for knowledge, inquiry, and learning outcomes with placeholder text.
    Free
    Add to Wishlist
    Download
    AI Customize
    Pie chart presentation slide showing three charts with percentages with text placeholders.
    Free
    Add to Wishlist
    Download
    AI Customize
    Six charts in different formats, including line, pie, bar, and gauge, all in blue and gray, displaying data trends.
    Add to Wishlist
    Download
    AI Customize
    Project management dashboard slide showing colored charts for net worth, sector allocation, and various financial metrics.
    Add to Wishlist
    Download
    AI Customize
    A bar chart with four categories displaying stacked colored bars, representing three series in orange, blue, and red.
    Add to Wishlist
    Download
    AI Customize
    Tachometer slide with four gauges in orange, red, blue, and green, each with captions below describing different readings.
    Add to Wishlist
    Download
    AI Customize
    Dashboard with bar charts, line graphs, and a gauge chart in various colors and a percentage indicator, on white background.
    Add to Wishlist
    Download
    AI Customize
    Circular chart with seven pastel colored segments, each with  icons and captions around it.
    Add to Wishlist
    Download
    AI Customize
    Dashboard template with three fuel gauge icons, each showing different fuel levels with placeholder text.