MILESTONE 🌟 5 Million+ creative minds trust SlideEgg! Grab 80% OFF

Dashboard PowerPoint Template and Google Slides

Dashboard PowerPoint Template and Google Slides
P.ID : 34890
    573 views
    47 Downloads
    Get Custom Slides by Experts
    Instantly Access Templates in PowerPoint

    Dashboard PowerPoint Template and Google Slides

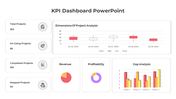
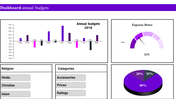
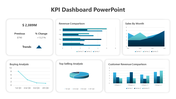
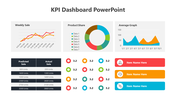
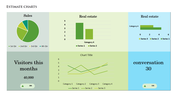
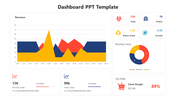
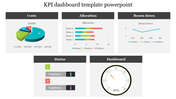
    The "Dashboard PowerPoint Template and Google Slides" offers a comprehensive dashboard presentation featuring the growth data of three different plants over time. The dashboard includes four charts, each providing valuable insights into the plants' growth progress.

    This template is perfect for professionals in agriculture, botany, environmental science, or any field related to plant growth and monitoring. It can be utilized by researchers, educators, agriculturalists, or environmentalists who need to visualize and analyze plant growth data effectively. You can utilize this template whenever you need to present or analyze the growth data of plants over time.

    Compatibility with both PowerPoint and Google Slides. Available in "16:9" and "4:3" aspect ratios, as well as Zip formats, ensuring compatibility with various screen dimensions and presentation preferences. The template is completely free and fully customizable. Download the Dashboard PowerPoint Template and Google Slides now.
    Advertisement

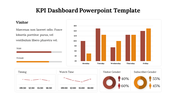
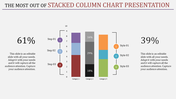
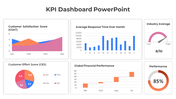
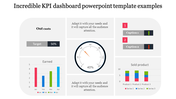
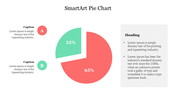
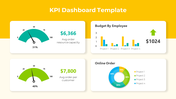
    You May Also Like These PowerPoint Templates

    Add to Wishlist
    Download
    AI Customize
    Budget slide featuring a colorful donut chart with percentages and five categories with placeholder text.
    Add to Wishlist
    Download
    AI Customize
    Colorful pie chart in PowerPoint slide showing 60, 30, and 10 percent segments with text boxes on a white backdrop.
    Free
    Add to Wishlist
    Download
    AI Customize
    Five triangular red pyramids arranged by size with corresponding percentage values, set against a minimalist gray background.
    Add to Wishlist
    Download
    AI Customize
    Animated slide design with orange gradient sidebar and three bar charts in blue, yellow, and green for different years.
    Add to Wishlist
    Download
    AI Customize
    Slide with a pie chart and a numbered list of five levels, each in orange, red, blue, green, and yellow.
    Add to Wishlist
    Download
    AI Customize
    Cycle chart slide featuring four percentage indicators in teal, green, blue, and red, with captions beow.
    Free
    Add to Wishlist
    Download
    AI Customize
    Timeline slide with horizontal bars in shades of green and blue, aligned to weekdays with placeholder text.
    Free
    Add to Wishlist
    Download
    AI Customize
    KWL chart PowerPoint template with sections for What I Know, What I Want to Know, and What I Learned with placeholder text.
    Add to Wishlist
    Download
    AI Customize
    Slide with three donut shaped percentage charts showing 70%, 50%, and 90%, with corresponding captions beneath each.
    Add to Wishlist
    Download
    AI Customize
    Five vibrant 3D blocks in purple, green, orange, blue, and yellow, with captions for each section.
    Add to Wishlist
    Download
    AI Customize
    Gantt chart in blue tones, showing task progress over weeks with horizontal bars and assigned team members.
    Free
    Add to Wishlist
    Download
    AI Customize
    A PPT chart template featuring a table layout with rows labeled Text and columns with bar charts in different shades of blue.
    Add to Wishlist
    Download
    AI Customize
    Bar chart slide design with stacked bars showing three categories per item and percentage captions on the left.
    Add to Wishlist
    Download
    AI Customize
    A donut chart with four sections in green, red, and white, labeled with percentages, and text boxes around it.
    Free
    Add to Wishlist
    Download
    AI Customize
    PPT slide with a blue bar chart showing percentages for the years 2016 to 2021 with a woman standing next to the chart.
    Add to Wishlist
    Download
    AI Customize
    Business column chart template showing four bar sections, each representing industries with icons and data percentages.
    Add to Wishlist
    Download
    AI Customize
    Colorful bar chart PPT template displaying four sections with data values and corresponding captions for 2018 to 2021.
    Add to Wishlist
    Download
    AI Customize
    Gantt chart with a task breakdown, progress percentages, and a status table for project planning and execution.
    Free
    Add to Wishlist
    Download
    AI Customize
    Five-step timeline with icons for connectivity, achievement, computers, pie chart, and security, paired with text.