Unique Dashboard PowerPoint And Google Slides Template

Dashboard with bar charts, line graphs, and a gauge chart in various colors and a percentage indicator, on white background.
P.ID : 1941
    677 views
    49 Downloads
    Get Custom Slides by Experts
    Instantly Access Templates in PowerPoint

    Best Dashboard PowerPoint Template


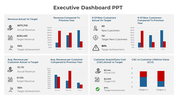
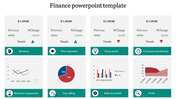
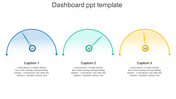
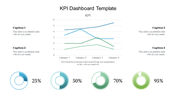
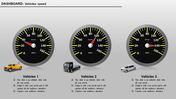
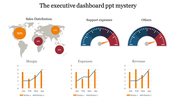
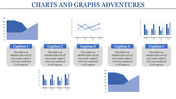
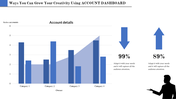
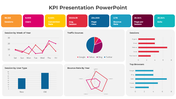
    A dashboard serves as a visual platform that displays essential data and metrics, allowing users to efficiently monitor performance, analyze trends, and make informed decisions. It acts as a central hub for facilitating data-driven decision-making processes. Our Dashboard PowerPoint template is a dynamic tool for professionals, including executives, managers, analysts, and project leaders. With editable slides, users can customize the dashboard to align with specific reporting needs and organizational goals. This versatile template offers 5 options and editable graphs and charts, featuring a cohesive multicolor theme. Whether tracking sales, monitoring projects, or analyzing finances, it provides a visually appealing and user-friendly interface. Empower your audience with data-driven decisions for organizational success. Download our customizable "Dashboard" template today.


    Features of this template


      • 100% customizable slides and easy to download.
      • The slide contains 16:9 and 4:3 formats.
      • Easy to change the colors of the slide quickly.
      • Highly compatible with PowerPoint and Google Slides.
      Advertisement

      You May Also Like These PowerPoint Templates

      Free
      Add to Wishlist
      Download
      AI Customize
      Project dashboard with a table containing rows for tasks, dates, and signature for author, client, and manager approval.
      Free
      Add to Wishlist
      Download
      AI Customize
      Dashboard with line graphs, a circular chart with three segments, and labeled financial metrics, in red, orange, and green.
      Add to Wishlist
      Download
      AI Customize
      Dashboard slide showing Zantedeschia, Celosia, and Calendula growth data with a bar chart from 2012 to 2017.
      Add to Wishlist
      Download
      AI Customize
      Business dashboard with progress indicators for promotion, channel management, and revenue metrics.
      Add to Wishlist
      Download
      AI Customize
      A dashboard style slide showing plant growth data for Zantedeschia, Celosia, and Calendula with gauge charts and a bar graph.
      Free
      Add to Wishlist
      Download
      AI Customize
      Colorful dashboard style meters PPT slide with captions and placeholder text.
      Free
      Add to Wishlist
      Download
      AI Customize
      Dashboard layout featuring a line graph, pie chart, net worth value, and categorized assets and liabilities in green theme.
      Free
      Add to Wishlist
      Download
      AI Customize
      Executive dashboard slide featuring different vehicles like bike, car, container, train, and plane with title sections.
      Free
      Add to Wishlist
      Download
      AI Customize
      Executive dashboard template featuring six blue columns with titles and alternating light and dark blue text boxes.
      Add to Wishlist
      Download
      AI Customize
      Colorful dashboard PPT template featuring financial figures, text placeholders, and a radar chart for visual data analysis.
      Free
      Add to Wishlist
      Download
      AI Customize
      PowerPoint template featuring a colorful dashboard with bar graphs, pie charts, progress rings, and a timeline for data.
      Free
      Add to Wishlist
      Download
      AI Customize
      Free KPI PPT Template For Presentation & Google Slides
      Free
      Add to Wishlist
      Download
      AI Customize
      Dashboard layout includes a line graph, pie chart, and three bar graphs, all colored in red, green, and blue.
      Add to Wishlist
      Download
      AI Customize
      KPI dashboard slide featuring six charts vertical bars, horizontal bars, area graph, pie chart, and column bar graphs.
      Add to Wishlist
      Download
      AI Customize
      KPI dashboard highlighting supplier statistics using donut charts, order-to-invoice process, and bar charts.
      Free
      Add to Wishlist
      Download
      AI Customize
      A slide with a sleek dashboard design that includes colorful data visualizations like pie charts, graphs, and progress bars.
      Free
      Add to Wishlist
      Download
      AI Customize
      Project progress dashboard with bar graphs, pie charts, and key metrics displayed on a blue and orange theme.
      Free
      Add to Wishlist
      Download
      AI Customize
      KPI slide displaying three circular meters with red, green, and orange sections, with text descriptions on the right.
      Free
      Add to Wishlist
      Download
      AI Customize
      KPI PPT Template with three colourful circular progress charts  showing percentages, growth indicators, and  bar charts.