Free - Elegant PowerPoint Charts and Graphs Template and Google Slides

Free
Visual layout of various charts, including area and bar graphs, arranged in a grid format with caption areas.
P.ID : 10814
    961 views
    305 Downloads
    Get Custom Slides by Experts
    Instantly Access Templates in PowerPoint

    PowerPoint Charts and Graphs Template and Google Slides


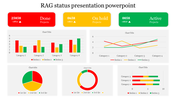
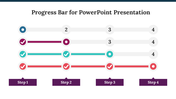
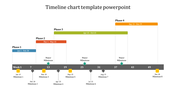
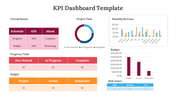
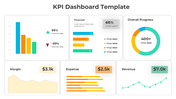
    How do you simplify complex data and make your presentations visually compelling? Our PowerPoint Chart and Graph template has the answer. Our template isn't just about colors; it's about clarity and comprehension. With intuitive design elements and clear descriptions, you can transform intricate information into engaging visuals that resonate with your audience. 


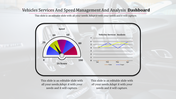
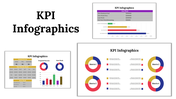
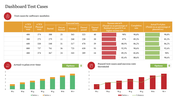
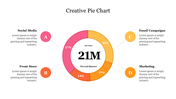
    A sleek combination of blue and grey, creating a sophisticated yet approachable palette for your charts and graphs. Each section is meticulously designed to guide your audience through the complexities of your data, with description boxes providing clarity and context.


    Perfect for analysts, educators, and presenters across various industries, our Chart and Graph template empowers you to communicate your data effectively. Whether you're analyzing trends, forecasting projections, or highlighting insights, this template provides a powerful platform to showcase your information.


    So, are you ready to elevate your presentations and make your data shine? With our Chart and Graph template, simplifying complexity and engaging your audience has never been easier. It's time to transform your data into a compelling narrative.


    Features of the template

    • 100% customizable slides and easy to download.
    • Slides are available in different nodes & colors.
    • The slide contains 16:9 and 4:3 formats.
    • It is easy to change the colors of the slide quickly. 
    • Well-crafted template with an instant download facility.

    Advertisement

    You May Also Like These PowerPoint Templates

    Add to Wishlist
    Download
    AI Customize
    Colorful business analytics dashboard displaying bar graphs, line charts, and percentage indicators in a structured layout.
    Add to Wishlist
    Download
    AI Customize
    Dashboard template displaying a project timeline with a Gantt chart, project details, and phases from initiation to closure.
    Add to Wishlist
    Download
    AI Customize
    Stacked column chart with three categories, percentage labels, and circular step icons on both sides with percentage figures.
    Add to Wishlist
    Download
    AI Customize
    A stock chart with five vertical bars in orange and teal, representing financial data for a day period.
    Add to Wishlist
    Download
    AI Customize
    Line chart with labeled high and low points across a fluctuating path, illustrating peaks and troughs in data trends.
    Add to Wishlist
    Download
    AI Customize
    Dashboard layout with income, expenses, profit, and cash flow figures on the left, a project budget chart in the center.
    Add to Wishlist
    Download
    AI Customize
    Dashboard template with pink charts showing facebook and twitter activity, percentage rings, and a page growth graph.
    Add to Wishlist
    Download
    AI Customize
    Line chart template with two lines and labeled data points, along with caption blocks on the left.
    Add to Wishlist
    Download
    AI Customize
    A line graph showing a plot structure with key points marked by colored dots, representing key stages.
    Add to Wishlist
    Download
    AI Customize
    SEO marketing plan template with icons representing different elements like e-commerce, email, and global marketing.
    Add to Wishlist
    Download
    AI Customize
    Slide deck showcasing various pie chart infographics in different colors and sections for data visualization.
    Add to Wishlist
    Download
    AI Customize
    Sentiment meter infographic displaying six emotions in a colorful fan design, each labeled with placeholders text areas.
    Free
    Add to Wishlist
    Download
    AI Customize
    Slide deck showcasing KWL chart layouts with colorful sections in purple, yellow, and teal, for structured insights.
    Add to Wishlist
    Download
    AI Customize
    Chart guide slide with two green-tone line graphs displaying data points, captions on the right, and a text footer.
    Add to Wishlist
    Download
    AI Customize
    KPI Dashboard PowerPoint template displaying key metrics, including count of contracts, revenues, and costs.
    Free
    Add to Wishlist
    Download
    AI Customize
    Pie chart illustration showcasing five data segments in varying colors with percentage labels and connected captions areas.
    Add to Wishlist
    Download
    AI Customize
    Vertical Microsoft infographic with four colored arrows each labeled with icons for business, target, analytics, and money.
    Add to Wishlist
    Download
    AI Customize
    Steps to growth slide featuring a chart with four arrows indicating yearly growth percentages and a large text section.
    Add to Wishlist
    Download
    AI Customize
    Tachometer template with percentage markers and color-coded designs, each paired with caption areas.