Best KPI PowerPoint Template Design for Presentation

Financial highlights slide with bar chart and circular gauges tracking sales, operating income, and expenses.
P.ID : 1827
    2.7K+ views
    95 Downloads
    Get Custom Slides by Experts
    Instantly Access Templates in PowerPoint

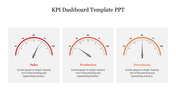
    Measure Success with KPI PowerPoint Template


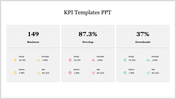
    Navigate the metrics landscape with confidence using our KPI Presentation PowerPoint Template. Key performance indicators are the heartbeat of business evaluation, and this template will guide you through the intricacies of data interpretation.

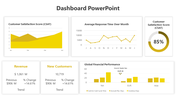
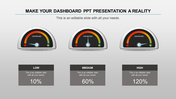
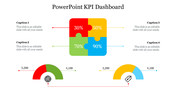
    Immerse yourself in the visually compelling design featuring a 12-month bar graph, portraying your data journey with clarity and precision. The three meters, each accompanied by text areas, act as your storytelling canvas, enabling you to articulate KPI reports with impact and insight.

    Who stands to benefit from this KPI powerhouse? Analysts, business leaders, and decision-makers seeking to elevate their data-driven strategies. It's your gateway to KPI excellence. Ready to revolutionize the way you present your performance metrics? Let our KPI PowerPoint Template be your ally, your key to unlocking new heights of business success. Seize the moment; your KPI journey starts here!

    Features of the template


    • 100% customizable slides are easy to download.
    • Slides are available in different colors.
    • The slide has 4:3 and 16:9 formats.
    • It is easy to change the slide colors quickly.
    • It has a cute design to impress an audience.
    • Create feature-rich, animated presentations.
    Advertisement

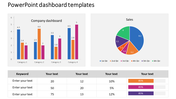
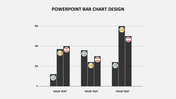
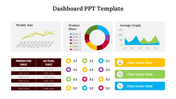
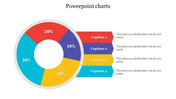
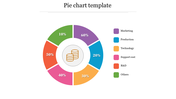
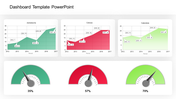
    You May Also Like These PowerPoint Templates

    Free
    Add to Wishlist
    Download
    AI Customize
    Bar chart comparing business targets and profits across quarters, with orange and blue bars labeled by month.
    Add to Wishlist
    Download
    AI Customize
    Budget slide featuring a colorful donut chart with percentages and five categories with placeholder text.
    Add to Wishlist
    Download
    AI Customize
    Colorful pie chart in PowerPoint slide showing 60, 30, and 10 percent segments with text boxes on a white backdrop.
    Free
    Add to Wishlist
    Download
    AI Customize
    Five triangular red pyramids arranged by size with corresponding percentage values, set against a minimalist gray background.
    Add to Wishlist
    Download
    AI Customize
    Company annual report slide featuring financial data including net income, assets, deposits, and shareholders' equity.
    Add to Wishlist
    Download
    AI Customize
    Animated slide design with orange gradient sidebar and three bar charts in blue, yellow, and green for different years.
    Add to Wishlist
    Download
    AI Customize
    Slide with a pie chart and a numbered list of five levels, each in orange, red, blue, green, and yellow.
    Add to Wishlist
    Download
    AI Customize
    Company annual report template featuring a line chart with two data series and space for points and descriptions with text.
    Add to Wishlist
    Download
    AI Customize
    Cycle chart slide featuring four percentage indicators in teal, green, blue, and red, with captions beow.
    Free
    Add to Wishlist
    Download
    AI Customize
    Timeline slide with horizontal bars in shades of green and blue, aligned to weekdays with placeholder text.
    Free
    Add to Wishlist
    Download
    AI Customize
    KWL chart PowerPoint template with sections for What I Know, What I Want to Know, and What I Learned with placeholder text.
    Add to Wishlist
    Download
    AI Customize
    Five vibrant 3D blocks in purple, green, orange, blue, and yellow, with captions for each section.
    Free
    Add to Wishlist
    Download
    AI Customize
    A PPT chart template featuring a table layout with rows labeled Text and columns with bar charts in different shades of blue.
    Add to Wishlist
    Download
    AI Customize
    Bar chart slide design with stacked bars showing three categories per item and percentage captions on the left.
    Add to Wishlist
    Download
    AI Customize
    A donut chart with four sections in green, red, and white, labeled with percentages, and text boxes around it.
    Free
    Add to Wishlist
    Download
    AI Customize
    PPT slide with a blue bar chart showing percentages for the years 2016 to 2021 with a woman standing next to the chart.
    Add to Wishlist
    Download
    AI Customize
    Business column chart template showing four bar sections, each representing industries with icons and data percentages.
    Add to Wishlist
    Download
    AI Customize
    Colorful bar chart slide for an annual report in PowerPoint, displaying monthly data from January to December.