Elegant KPI Presentation Template Designs PowerPoint


KPI Presentation Slide
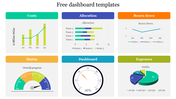
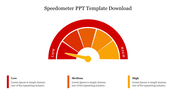
Unlock the road to success with our dynamic KPI Presentation Template – a gateway to seamlessly monitor and steer your business towards unprecedented growth. Picture this: Just as a skilled driver relies on a speed dashboard to navigate diverse terrains, our KPI template empowers you to effortlessly gauge and optimize your business performance. Rev up your presentations with the sleek imagery of varied vehicles on a speed dashboard – each representing a unique facet of your enterprise.
Dive into the world of possibilities with an array of free KPI dashboard templates, where innovation meets simplicity. From Excel to Google Data Studio, explore the diverse landscapes of business, marketing, and sales with templates tailored to your specific needs. As the road stretches before you, embrace the power to customize these templates like never before. Add icons, tweak text areas, and let your data drive the narrative of success. Remember, the key to a winning journey lies in using these templates to transform your data into actionable insights. Don’t just present; accelerate your impact. Ask your audience to buckle up and join the ride towards excellence by adopting our KPI Presentation Template today. Your business deserves a smooth ride to success – let the template be your compass on this exciting journey!
Features of the template
- 100% customizable slides and easy to download.
- Slides are available in different colors
- The slide has 4:3 and 16:9 formats.
- Easy to change the slide colors quickly.
- Appealing Presentation to impress an audience.
- Create feature-rich slide presentations.
- An eye-pleasing color slide helps to give a catchy display.
- Highly compatible with PowerPoint and Google Slides.


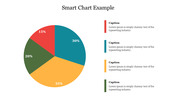
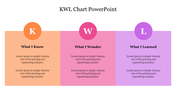
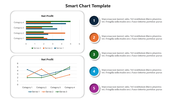
You May Also Like These PowerPoint Templates
Add to Wishlist
Download
AI Customize

Add to Wishlist
Download
AI Customize

Add to Wishlist
Download
AI Customize


Add to Wishlist
Download
AI Customize

Add to Wishlist
Download
AI Customize

Add to Wishlist
Download
AI Customize

Add to Wishlist
Download
AI Customize


Add to Wishlist
Download
AI Customize


Add to Wishlist
Download
AI Customize

Add to Wishlist
Download
AI Customize

Add to Wishlist
Download
AI Customize

Add to Wishlist
Download
AI Customize

Add to Wishlist
Download
AI Customize

Add to Wishlist
Download
AI Customize

Add to Wishlist
Download
AI Customize

Add to Wishlist
Download
AI Customize

Add to Wishlist
Download
AI Customize
