PowerPoint Speedometer Template And Google Slides Themes
Nodes

Colors
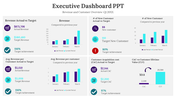
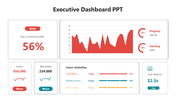
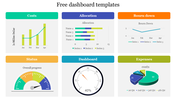
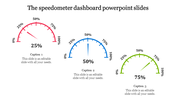
Speedometer Presentation Template And Google Slides Themes
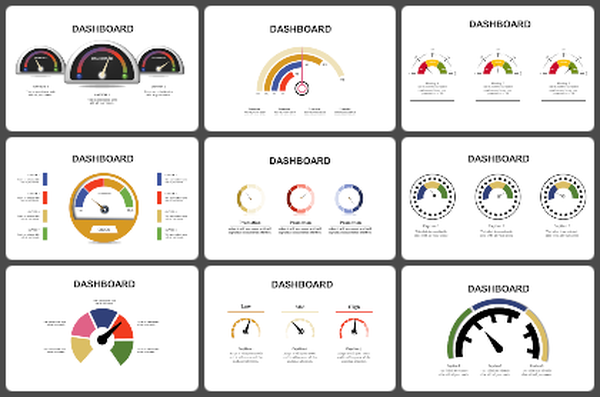
Shift your presentations into high gear with this eye-catching template featuring four distinct speedometer visuals. Each speedometer offers a unique scale, allowing you to showcase various aspects of progress, performance, or goal achievement.
What is so unique about this slide?
This means you can show different levels of progress or compare different things. It's like having a visual roadmap. Everyone can easily see how things are going and where you're headed.
Perfect for:
Project managers, sales teams, teachers, and anyone who wants to track progress in a fun way.
Use it to:
- Track project milestones
- Show how close you are to reaching goals
- Compare results
- Make learning progress fun and exciting
Get ready to impress your audience! Download this template and make your presentations zoom!
Features of the template
- 100% customizable slides and easy to download.
- Slides are available in different nodes & colors.
- The slide contains 16:9 and 4:3 formats.
- It is easy to change the colors of the slide quickly.
- Well-crafted template with an instant download facility.
More Collections for PowerPoint Speedometer Template
Recommended based on this template.



Similar Templates to PowerPoint Speedometer Template
Showing20 of69,218 templates