Chart PowerPoint Templates for Professional Presentation

Chart template featuring bar, line, and calendar charts with editable placeholders for Q1, Q2, and monthly data.
P.ID : 4167
    414 views
    13 Downloads
    Get Custom Slides by Experts
    Instantly Access Templates in PowerPoint

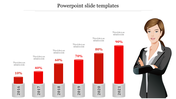
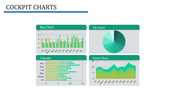
    Chart  Presentation Template 


    Are you looking for a way to present your data in a visually appealing and easy-to-understand way? Look no further than our professionally designed Chart Template PPT. With its wide variety of charts and graphs, this template will help you communicate your message clearly and effectively.

    This template features a different chart or graph type to showcase your data. You can use these slides to present data on sales, profits, expenses, and more. Plus, with its easy-to-use drag-and-drop icons, you can easily customize the template to fit your specific needs.

    Whether you're a business professional, a student, or a teacher, our Chart Template PPT is the perfect tool to help you visually represent your data. So why wait? Download it today and start creating stunning presentations!

    Features of the template:

    • Slides are available in different nodes & colors.
    • Easy to change the slide colors.
    • 100 % customizable slides and easy to download.
    • Well-crafted template with instant download.
    Advertisement

    You May Also Like These PowerPoint Templates

    Add to Wishlist
    Download
    AI Customize
    KPI dashboard with a dual-line graph, balance performance gauge, and quarterly income metrics.
    Free
    Add to Wishlist
    Download
    AI Customize
    Project dashboard with a table containing rows for tasks, dates, and signature for author, client, and manager approval.
    Add to Wishlist
    Download
    AI Customize
    Business dashboard with progress indicators for promotion, channel management, and revenue metrics.
    Free
    Add to Wishlist
    Download
    AI Customize
    Colorful dashboard style meters PPT slide with captions and placeholder text.
    Free
    Add to Wishlist
    Download
    AI Customize
    Dashboard layout featuring a line graph, pie chart, net worth value, and categorized assets and liabilities in green theme.
    Free
    Add to Wishlist
    Download
    AI Customize
    Executive dashboard slide featuring different vehicles like bike, car, container, train, and plane with title sections.
    Free
    Add to Wishlist
    Download
    AI Customize
    Executive dashboard template featuring six blue columns with titles and alternating light and dark blue text boxes.
    Add to Wishlist
    Download
    AI Customize
    Colorful dashboard PPT template featuring financial figures, text placeholders, and a radar chart for visual data analysis.
    Free
    Add to Wishlist
    Download
    AI Customize
    PowerPoint template featuring a colorful dashboard with bar graphs, pie charts, progress rings, and a timeline for data.
    Free
    Add to Wishlist
    Download
    AI Customize
    Dashboard layout includes a line graph, pie chart, and three bar graphs, all colored in red, green, and blue.
    Add to Wishlist
    Download
    AI Customize
    KPI dashboard slide featuring six charts vertical bars, horizontal bars, area graph, pie chart, and column bar graphs.
    Add to Wishlist
    Download
    AI Customize
    KPI dashboard highlighting supplier statistics using donut charts, order-to-invoice process, and bar charts.
    Free
    Add to Wishlist
    Download
    AI Customize
    A slide with a sleek dashboard design that includes colorful data visualizations like pie charts, graphs, and progress bars.
    Free
    Add to Wishlist
    Download
    AI Customize
    KPI slide displaying three circular meters with red, green, and orange sections, with text descriptions on the right.
    Add to Wishlist
    Download
    AI Customize
    Executive summary dashboard featuring contract metrics, costs vs. revenue, and breakdowns by status, industry, and category.
    Free
    Add to Wishlist
    Download
    AI Customize
    Semi circular speedometer graphic with red to yellow gradient, and three placeholder text below.
    Add to Wishlist
    Download
    AI Customize
    RAG status slide with a task table featuring colored status indicators and four charts, including pie and line graphs.