Simple Nine Node Gantt Template PowerPoint Presentation

Project timeline Gantt chart with color coded bars indicating task descriptions, assigned resources, and milestone markers.
P.ID : 34195
    1.1K+ views
    132 Downloads
    Get Custom Slides by Experts
    Instantly Access Templates in PowerPoint

    Transform Your Presentations with Vibrant Visuals


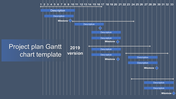
    Looking to revolutionize your project management presentations? Dive into our vibrant Gantt Template PowerPoint! Picture this: three dynamic, color-coded rectangles adorning your slides, transforming data into captivating visual narratives, instantly engaging your audience! This isn't just any template; it's a game-changer! Glide effortlessly through complex project timelines with our user-friendly Gantt chart template. Seamlessly track tasks, deadlines, and progress with precision and clarity. Whether you're a seasoned business professional, a diligent student, or a proactive planner, this template empowers you to communicate your ideas with finesse.

    Unlock the potential of your presentations! With our Gantt Template PowerPoint, conveying project timelines becomes a breeze. Impress clients, dazzle colleagues, and ace your presentations with confidence. Don't settle for mediocrity—elevate your slides to new heights! Ready to elevate your presentations? Download our Gantt chart PowerPoint template now and transform your ideas into impactful visuals! Experience the difference today!

    Features of the template

    • 100% customizable slides and easy to download.
    • Slides are available in different colors
    • The slide has 4:3 and 16:9 formats.
    • Easy to change the slide colors quickly.
    • Appealing Presentation to impress an audience.
    • Create feature-rich slide presentations.
    • An eye-pleasing color slide helps to give a catchy display.
    • It is proficient with Google Slides and PowerPoint.
    Advertisement

    You May Also Like These PowerPoint Templates

    Add to Wishlist
    Download
    AI Customize
    Infographic charts for PowerPoint slide featuring bar, pie, and map charts in different styles and colors.
    Free
    Add to Wishlist
    Download
    AI Customize
    Five vertical purple bars in a row, each on a gray base, with a businesswoman figure on the right side.
    Add to Wishlist
    Download
    AI Customize
    Executive dashboard slide with gender bar chart, line graph,pie chart, and area chart for executive data analysis.
    Free
    Add to Wishlist
    Download
    AI Customize
    Template with six green bar graphs labeled by years from 2016 to 2021, and a woman in a formal outfit.
    Free
    Add to Wishlist
    Download
    AI Customize
    Bar chart comparing business targets and profits across quarters, with orange and blue bars labeled by month.
    Add to Wishlist
    Download
    AI Customize
    Budget slide featuring a colorful donut chart with percentages and five categories with placeholder text.
    Add to Wishlist
    Download
    AI Customize
    Electricity dashboard showing a bar chart on the left and a line chart on the right, depicting electricity data.
    Add to Wishlist
    Download
    AI Customize
    Dashboard slide with three gauges displaying percentage levels, labeled low, middle, and high with placeholder text.
    Add to Wishlist
    Download
    AI Customize
    Colorful pie chart in PowerPoint slide showing 60, 30, and 10 percent segments with text boxes on a white backdrop.
    Free
    Add to Wishlist
    Download
    AI Customize
    Five triangular red pyramids arranged by size with corresponding percentage values, set against a minimalist gray background.
    Add to Wishlist
    Download
    AI Customize
    Timeline slide showing events from January to May, with red flags marking milestones and colored bars for project durations.
    Add to Wishlist
    Download
    AI Customize
    Dashboard overview slide displaying traffic, payment, server load, expenses, and product metrics using graphs and charts.
    Free
    Add to Wishlist
    Download
    AI Customize
    Bar graph comparing financial data with blue and purple theme, with a text box explaining a high level approach.
    Add to Wishlist
    Download
    AI Customize
    A colorful timeline PPT slide displaying project milestones for system development tasks from 2016 to 2022 with text area.
    Add to Wishlist
    Download
    AI Customize
    Company annual report slide featuring financial data including net income, assets, deposits, and shareholders' equity.
    Add to Wishlist
    Download
    AI Customize
    Animated slide design with orange gradient sidebar and three bar charts in blue, yellow, and green for different years.
    Add to Wishlist
    Download
    AI Customize
    Slide with a pie chart and a numbered list of five levels, each in orange, red, blue, green, and yellow.
    Add to Wishlist
    Download
    AI Customize
    Company annual report template featuring a line chart with two data series and space for points and descriptions with text.
    Add to Wishlist
    Download
    AI Customize
    Horizontal timeline with colorful blocks representing project phases, featuring triangular and diamond shapes with dates.
    Add to Wishlist
    Download
    AI Customize
    Gantt chart with four tasks displayed horizontally, with tasks scheduled across six weeks in various colors.