Download the Best Infographic Charts For PowerPoint

Infographic charts for PowerPoint slide featuring bar, pie, and map charts in different styles and colors.
P.ID : 6154
    916 views
    72 Downloads
    Get Custom Slides by Experts
    Instantly Access Templates in PowerPoint

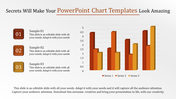
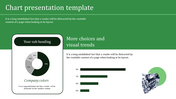
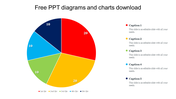
    Creative Infographics Chart Theme Presentation Slide


    Create compelling Infographic Charts for PowerPoint with a professional green-themed template, ideal for business presentations. Utilize nodes to showcase various elements such as PowerPoint infographic chart templates, data visualization slide deck designs, and information graphic presentation layouts. Incorporate graphical representation template structures and visual data PowerPoint templates to enhance data clarity and comprehension. Seamlessly integrate infographic chart slide designs and statistical visualization presentation formats to visually illustrate key insights. Utilize graphical data representation slide templates and visual information PowerPoint designs to convey complex information effectively. With this meticulously crafted set of Chart and Graph Presentation Templates, businesses can create visually stunning presentations that engage and inform audiences with ease.


    Features of this template:

    • 100% customizable slides and easy to download.
    • Slides available in different nodes & colors.
    • The slide contained 16:9 and 4:3 format.
    • Easy to change the slide colors quickly.
    • Well-crafted template with instant download facility.
    Advertisement

    You May Also Like These PowerPoint Templates

    Free
    Add to Wishlist
    Download
    AI Customize
    Green and black area chart with a star shaped yellow badge and four circular icons with text below.
    Free
    Add to Wishlist
    Download
    AI Customize
    Creative infographic with a curved orange graph divided into four steps, each with an icon and label.
    Add to Wishlist
    Download
    AI Customize
    Bar chart with green hues, showing data for six categories, with side status boxes and light text.
    Add to Wishlist
    Download
    AI Customize
    Creative PowerPoint slide with two lines on a chart yellow and red with a green dot marking the highest point on the line.
    Free
    Add to Wishlist
    Download
    AI Customize
    Three column layout with blue megaphone, orange lightbulb, and red envelope icons on a beige background.
    Free
    Add to Wishlist
    Download
    AI Customize
    A simple chart slide with overlaid blue, green, orange, and yellow circles of varying sizes with a graph and captions.
    Add to Wishlist
    Download
    AI Customize
    Gantt chart PowerPoint template showing a timeline for multiple targets across January, February, and March, with milestones.
    Add to Wishlist
    Download
    AI Customize
    Bar chart slide showcasing yearly data from 2016 to 2021, with three distinct bar categories and values in shades of purple.
    Add to Wishlist
    Download
    AI Customize
    Bar chart slide with colorful conical graphs representing different categories, accompanied by labeled captions and icons.
    Add to Wishlist
    Download
    AI Customize
    3D cone chart with orange, pink, and blue segments, placed on a gray platform with a white background.
    Add to Wishlist
    Download
    AI Customize
    Bar chart slide showing the performance of four products with categories like sales growth, market share, and profit margin.
    Add to Wishlist
    Download
    AI Customize
    Slide displaying two pie charts with quarter wise performance data, along with performance percentages at the bottom.
    Add to Wishlist
    Download
    AI Customize
    Slide featuring a businessman pointing at a board with a pie chart and two circular progress visuals in red and yellow.
    Add to Wishlist
    Download
    AI Customize
    PowerPoint slide showcasing a chart with project status trends and a progress bar for each year.
    Add to Wishlist
    Download
    AI Customize
    Slide featuring three green pie charts and a line graph below, illustrating data trends for different categories.
    Add to Wishlist
    Download
    AI Customize
    Colorful timeline PowerPoint chart illustrating shifts for various employees throughout the day with peak hours highlighted.
    Free
    Add to Wishlist
    Download
    AI Customize
    Business plan infographic with a four-quadrant layout labeled with sales strategies and a 3D pie chart on the right.
    Add to Wishlist
    Download
    AI Customize
    Four panel chart slide featuring a line, bar, and pie chart, each displaying data trends and comparisons.
    Free
    Add to Wishlist
    Download
    AI Customize
    Bar graph showing revenue and sales data for 3D Ocean, Web, Graphics, Video, and Design in a business plan presentation.