Professional Chart PowerPoint Template and Google Slides Themes

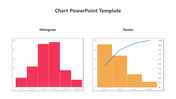
Professional Chart PowerPoint Template and Google Slides
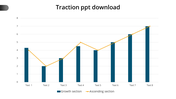
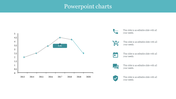
Struggling to clearly present your company's growth analysis? Our Professional Chart PowerPoint Template and Google Slides is the perfect solution. Featuring a bar chart in sophisticated blue and purple hues, this template offers a clean and modern look on a white background, ensuring maximum readability.
Ideal for illustrating your company's growth and performance metrics, this template provides a visually engaging way to convey complex data. With ample space for annotations and detailed analysis, your audience will grasp the key insights effortlessly.
Enhance your presentations and impress your stakeholders with this fully customizable and visually appealing template. Make your data stand out and drive your message home. Download now!
Features of the template
- 100% customizable slides and easy to download.
- Slides are available in different nodes & colors.
- The slide contains 16:9 and 4:3 formats.
- It is easy to change the colors of the slide quickly.
- Well-crafted template with an instant download facility.


You May Also Like These PowerPoint Templates
Add to Wishlist
Download
AI Customize

Add to Wishlist
Download
AI Customize

Add to Wishlist
Download
AI Customize

Add to Wishlist
Download
AI Customize

Add to Wishlist
Download
AI Customize

Add to Wishlist
Download
AI Customize

Add to Wishlist
Download
AI Customize

Add to Wishlist
Download
AI Customize

Add to Wishlist
Download
AI Customize

Add to Wishlist
Download
AI Customize

Add to Wishlist
Download
AI Customize

Add to Wishlist
Download
AI Customize

Add to Wishlist
Download
AI Customize

Add to Wishlist
Download
AI Customize

Add to Wishlist
Download
AI Customize

Add to Wishlist
Download
AI Customize

Add to Wishlist
Download
AI Customize

Add to Wishlist
Download
AI Customize

Add to Wishlist
Download
AI Customize

Add to Wishlist
Download
AI Customize
