Amazing Chart PowerPoint Presentation Template Download

Professional setting with pie charts showing task distribution in red tones for analysis, collection, and development.
P.ID : 43795
    58 views
    4 Downloads
    Get Custom Slides by Experts
    Instantly Access Templates in PowerPoint

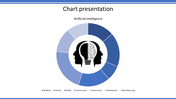
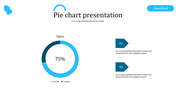
    Stunning Chart Presentation

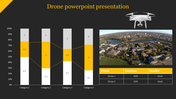
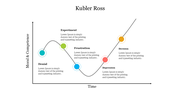
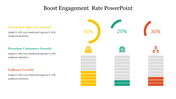
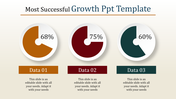
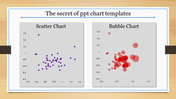
    Chart Diagram for the display is a modern and creative chart produced with PPT shapes and data drive charts. Ideal for simple data displays and eye-catching visual infographics. Users can make urbane charts for corporate reports, analysis, data collection, and plotting. Members of the office team Infographic displays are excellent for summarizing harsh facts for general audiences. Using charts to compare values is a skilled strategy that charms the audience. You can change the data-driven versions of the graph easily. Users can rapidly alter the chart and customize the report to their ideas. Try it today!

    Features of this Template 

    • 100 % customizable slides and easy to download.
    • Slides are available in different colors.
    • The SlideSlide has 4:3 and 16:9 formats.
    • Easy to change the slide colors quickly.
    • Appealing Presentation to impress an audience.
    • Create feature-rich slide presentations. 
    • An eye-pleasing color slide helps to give a catchy presentation. Crisp and clear font styles and design Presentation
    • Useful chart  Presentation.
    Advertisement

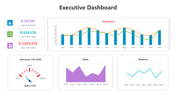
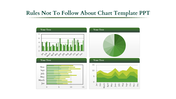
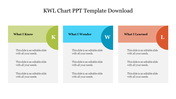
    You May Also Like These PowerPoint Templates

    Add to Wishlist
    Download
    AI Customize
    Executive dashboard slide with a gauge displaying performance across different levels, labeled three sections.
    Free
    Add to Wishlist
    Download
    AI Customize
    Green and black area chart with a star shaped yellow badge and four circular icons with text below.
    Add to Wishlist
    Download
    AI Customize
    Marketing KPI template with three circular icons, and bar and line charts in blue, gray, and green below.
    Add to Wishlist
    Download
    AI Customize
    Bar chart with green hues, showing data for six categories, with side status boxes and light text.
    Free
    Add to Wishlist
    Download
    AI Customize
    Three column layout with blue megaphone, orange lightbulb, and red envelope icons on a beige background.
    Add to Wishlist
    Download
    AI Customize
    3D triangular bar chart in yellow, orange, and blue shades showing monthly data for four categories, on a dark background.
    Free
    Add to Wishlist
    Download
    AI Customize
    A simple chart slide with overlaid blue, green, orange, and yellow circles of varying sizes with a graph and captions.
    Add to Wishlist
    Download
    AI Customize
    Gantt chart PowerPoint template showing a timeline for multiple targets across January, February, and March, with milestones.
    Add to Wishlist
    Download
    AI Customize
    Bar chart slide showcasing yearly data from 2016 to 2021, with three distinct bar categories and values in shades of purple.
    Add to Wishlist
    Download
    AI Customize
    3D cone chart with orange, pink, and blue segments, placed on a gray platform with a white background.
    Add to Wishlist
    Download
    AI Customize
    Bar chart slide showing the performance of four products with categories like sales growth, market share, and profit margin.
    Add to Wishlist
    Download
    AI Customize
    Dashboard layout showing net worth value, asset categories in a pie chart, and bar chart for real estate comparisons.
    Add to Wishlist
    Download
    AI Customize
    PowerPoint slide showcasing a chart with project status trends and a progress bar for each year.
    Add to Wishlist
    Download
    AI Customize
    Slide featuring three green pie charts and a line graph below, illustrating data trends for different categories.
    Add to Wishlist
    Download
    AI Customize
    Four panel chart slide featuring a line, bar, and pie chart, each displaying data trends and comparisons.
    Free
    Add to Wishlist
    Download
    AI Customize
    Green bar graph depicting growth over six months, with two gear icons and captions on the left.
    Add to Wishlist
    Download
    AI Customize
    Slide featuring a 3D bar graph with three series on dark backdrop, a green star shaped badge, and text boxes below.
    Add to Wishlist
    Download
    AI Customize
    Project dashboard slide with a compass design,  featuring four labeled captions, and an orange sidebar for text.