Impressive Chart Presentation Template Slide Designs

Bar chart with green hues, showing data for six categories, with side status boxes and light text.
P.ID : 33026
    313 views
    18 Downloads
    Get Custom Slides by Experts
    Instantly Access Templates in PowerPoint

    Create Stunning Visuals with Our Chart Presentation Template


    Want to elevate your presentations with impactful charts? Our chart presentation template is designed for professionals, students, and anyone needing to present data effectively. This template combines clarity and visual appeal to make your data stand out.

    About our slide

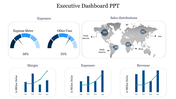
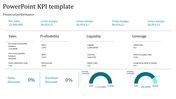
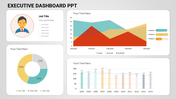
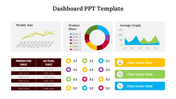
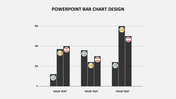
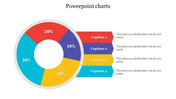
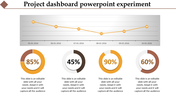
    This template features a bar chart image with space for data below, set against a clean white background. It helps you visualize data clearly, making it easier for your audience to understand your message.

    Purpose of the slide

    The purpose of this slide is to present data in an easy-to-understand structure. Use it to highlight key statistics, compare data sets, or show trends over time, ensuring your audience grasps the information quickly.


    Who Can Use?

    This template is perfect for all business professionals. Whether you’re presenting sales figures, research data, or academic results, this chart presentation template is an ideal tool to enhance your presentations.
    Try it now!

    Features of the template:


    • 100% customizable slides and easy to download.
    • The slides contain 16:9 and 4:3 formats.
    • Easy to change the colors quickly.
    • It is a 100% pre-designed slide.
    Advertisement

    You May Also Like These PowerPoint Templates

    Add to Wishlist
    Download
    AI Customize
    Executive dashboard slide with gender bar chart, line graph,pie chart, and area chart for executive data analysis.
    Free
    Add to Wishlist
    Download
    AI Customize
    Template with six green bar graphs labeled by years from 2016 to 2021, and a woman in a formal outfit.
    Free
    Add to Wishlist
    Download
    AI Customize
    Bar chart comparing business targets and profits across quarters, with orange and blue bars labeled by month.
    Free
    Add to Wishlist
    Download
    AI Customize
    PPT slide with a line chart showing monthly data and two pie charts for quarterly breakdown.
    Add to Wishlist
    Download
    AI Customize
    Electricity dashboard showing a bar chart on the left and a line chart on the right, depicting electricity data.
    Add to Wishlist
    Download
    AI Customize
    Dashboard slide with three gauges displaying percentage levels, labeled low, middle, and high with placeholder text.
    Add to Wishlist
    Download
    AI Customize
    Colorful pie chart in PowerPoint slide showing 60, 30, and 10 percent segments with text boxes on a white backdrop.
    Add to Wishlist
    Download
    AI Customize
    Dashboard overview slide displaying traffic, payment, server load, expenses, and product metrics using graphs and charts.
    Free
    Add to Wishlist
    Download
    AI Customize
    Bar graph comparing financial data with blue and purple theme, with a text box explaining a high level approach.
    Add to Wishlist
    Download
    AI Customize
    PowerPoint template showing a line graph with three products A, B, and C plotted over time from 2015 to 2019.
    Add to Wishlist
    Download
    AI Customize
    Company annual report slide featuring financial data including net income, assets, deposits, and shareholders' equity.
    Add to Wishlist
    Download
    AI Customize
    Slide with a pie chart and a numbered list of five levels, each in orange, red, blue, green, and yellow.
    Add to Wishlist
    Download
    AI Customize
    Company annual report template featuring a line chart with two data series and space for points and descriptions with text.
    Add to Wishlist
    Download
    AI Customize
    Cycle chart slide featuring four percentage indicators in teal, green, blue, and red, with captions beow.
    Free
    Add to Wishlist
    Download
    AI Customize
    Timeline slide with horizontal bars in shades of green and blue, aligned to weekdays with placeholder text.
    Free
    Add to Wishlist
    Download
    AI Customize
    KWL chart PowerPoint template with sections for What I Know, What I Want to Know, and What I Learned with placeholder text.
    Add to Wishlist
    Download
    AI Customize
    Use Dashboard PPT Template Slide Designs
    Add to Wishlist
    Download
    AI Customize
    Slide with three donut shaped percentage charts showing 70%, 50%, and 90%, with corresponding captions beneath each.
    Add to Wishlist
    Download
    AI Customize
    Gantt chart in blue tones, showing task progress over weeks with horizontal bars and assigned team members.