Free - Imaginative PPT Chart Templates Presentation Slides

Free
Timeline slide with horizontal bars in shades of green and blue, aligned to weekdays with placeholder text.
P.ID : 3563
    641 views
    114 Downloads
    Get Custom Slides by Experts
    Instantly Access Templates in PowerPoint

    PPT Chart Templates and Google Slides

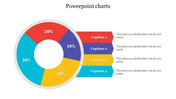
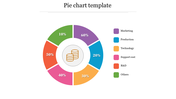
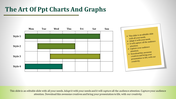
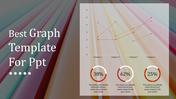
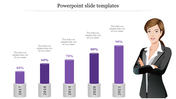
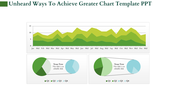
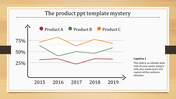
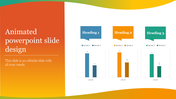
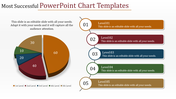
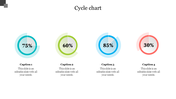
    Explore the dynamic world of  Chart PPT Templates to elevate your presentations with unparalleled visual appeal. Specifically designed for creative presentations and business settings, these templates feature a sleek timeline design with six nodes strategically placed for seamless information flow. The professional shades of colors incorporated into the charts not only enhance aesthetics but also lend a touch of sophistication to your content. Whether you're showcasing project milestones or business strategies, these presentation slide templates effortlessly convey complex ideas in a visually engaging manner. Revolutionize your presentation game by harnessing the power of these meticulously crafted PPT chart templates, ensuring that your information is not only comprehensible but also leaves a lasting impression on your audience.

    Features of the template:

    • Slides are available in different nodes & colors.
    • Easy to change the slide colors.
    • Well-crafted template with instant download.
    • 100 % customizable slides and easy to download.
    • Well-crafted template with instant download.
    Advertisement

    You May Also Like These PowerPoint Templates

    Free
    Add to Wishlist
    Download
    AI Customize
    Timeline slide with horizontal bars in shades of green and blue, aligned to weekdays with placeholder text.
    Free
    Add to Wishlist
    Download
    AI Customize
    KWL chart PowerPoint template with sections for What I Know, What I Want to Know, and What I Learned with placeholder text.
    Add to Wishlist
    Download
    AI Customize
    Slide with three donut shaped percentage charts showing 70%, 50%, and 90%, with corresponding captions beneath each.
    Add to Wishlist
    Download
    AI Customize
    Five vibrant 3D blocks in purple, green, orange, blue, and yellow, with captions for each section.
    Add to Wishlist
    Download
    AI Customize
    Gantt chart in blue tones, showing task progress over weeks with horizontal bars and assigned team members.
    Free
    Add to Wishlist
    Download
    AI Customize
    A PPT chart template featuring a table layout with rows labeled Text and columns with bar charts in different shades of blue.
    Add to Wishlist
    Download
    AI Customize
    Bar chart slide design with stacked bars showing three categories per item and percentage captions on the left.
    Add to Wishlist
    Download
    AI Customize
    A donut chart with four sections in green, red, and white, labeled with percentages, and text boxes around it.
    Free
    Add to Wishlist
    Download
    AI Customize
    PPT slide with a blue bar chart showing percentages for the years 2016 to 2021 with a woman standing next to the chart.
    Add to Wishlist
    Download
    AI Customize
    Business column chart template showing four bar sections, each representing industries with icons and data percentages.
    Add to Wishlist
    Download
    AI Customize
    Colorful bar chart PPT template displaying four sections with data values and corresponding captions for 2018 to 2021.
    Add to Wishlist
    Download
    AI Customize
    Gantt chart with a task breakdown, progress percentages, and a status table for project planning and execution.
    Free
    Add to Wishlist
    Download
    AI Customize
    Five-step timeline with icons for connectivity, achievement, computers, pie chart, and security, paired with text.
    Free
    Add to Wishlist
    Download
    AI Customize
    Line chart with data points marked by blue squares and black dots, displaying values from 2006 to 2014.
    Add to Wishlist
    Download
    AI Customize
    Bar chart with colorful columns of varying heights representing percentages, with social media icons below.
    Add to Wishlist
    Download
    AI Customize
    Gantt chart with colorful horizontal bars spanning from January to June, representing project timelines and milestones.
    Free
    Add to Wishlist
    Download
    AI Customize
    Slide with line and trends charts, showing five columns of data with placeholder text for each chart segment.
    Free
    Add to Wishlist
    Download
    AI Customize
    PowerPoint slide with a bar chart showcasing three data series for different examples.
    Add to Wishlist
    Download
    AI Customize
    Chart layout with stacked bar graphs in red, yellow, green, and teal representing A1 to A8, with captions above.