The Executive Dashboard PowerPoint And Google Slides

 Canva
Canva
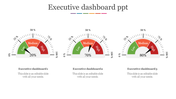
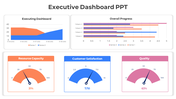
Executive Dashboard PPT Template and Google Slides
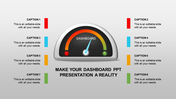
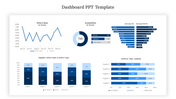
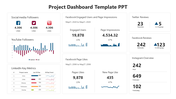
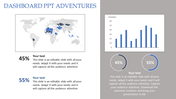
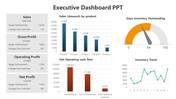
The "Executive Dashboard PPT Template and Google Slides" features a professional and sleek design tailored for executive-level presentations. Executive dashboards turn complex business data into clear insights. The Executive Dashboard PPT is a professional, fully editable slide deck designed to visualize performance metrics, KPIs, and analytics with clarity and impact.
This template is ideal for executives, managers, and professionals who need to present complex data, reports, or insights clearly and concisely. Whether you're delivering quarterly performance reviews, presenting strategic plans, or sharing key metrics with stakeholders, this template provides a visually appealing platform to convey critical information effectively.
Features of the template
- 100% customizable slides and easy to download.
- Slides are available in different nodes & colors.
- The slide contains 16:9 and 4:3 formats.
- It is easy to change the colors of the slide quickly.
- Well-crafted template with an instant download facility.


You May Also Like These PowerPoint Templates
Add to Wishlist
Download
Edit


Add to Wishlist
Download
Edit

Add to Wishlist
Download
Edit

Add to Wishlist
Download
Edit

Add to Wishlist
Download
Edit


Add to Wishlist
Download
Edit

Add to Wishlist
Download
Edit

Add to Wishlist
Download
Edit


Add to Wishlist
Download
Edit


Add to Wishlist
Download
Edit


Add to Wishlist
Download
Edit

