Engaging and Exciting KPI Presentation Template Themes

Marketing KPI dashboard comparing Google, Facebook, and Bing ads, featuring clicks, cost, line charts, and campaign analysis.
P.ID : 34115
    852 views
    77 Downloads
    Get Custom Slides by Experts
    Instantly Access Templates in PowerPoint

    KPI Dashboard PowerPoint Template and Google Slides Themes


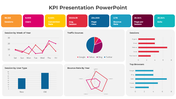
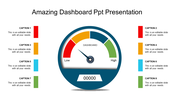
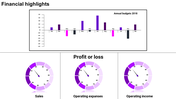
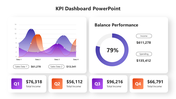
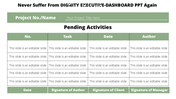
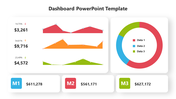
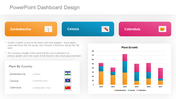
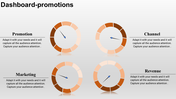
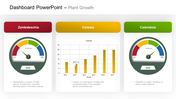
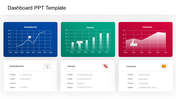
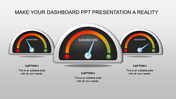
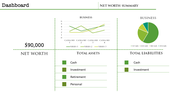
    Empower your presentations with our cutting-edge KPI Dashboard PowerPoint Template and Google Slides Themes, meticulously designed to amplify your data-driven storytelling. Crafted with precision, this template boasts six seamlessly integrated nodes, each featuring a caption, title holder, and text area against a sleek white backdrop. Dive deep into your metrics with visual representations of Google ads, Facebook ads, Bing ads, top campaigns, customer age, and top keywords presented in captivating graphs. Tailored for marketers, analysts, and business professionals, this versatile tool streamlines data visualization, fostering clarity and strategic decision-making. Elevate your presentations and captivate your audience with our user-friendly interface and actionable insights. Stay ahead of the curve and transform raw data into compelling narratives effortlessly. Revolutionize your presentations today with our KPI Dashboard template.

    Features of the Template

    • 100 % customizable slides.
    • The slide show is in 4:3, 16:9, zip format.
    • There is powerful connectivity with Google Slides and PowerPoint.
    • It is simple and quick to alter the slide's color.
    • An efficient template that can be easily accessed immediately.
    • Well-crafted template with an instant download facility
    Advertisement

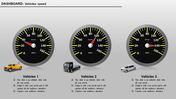
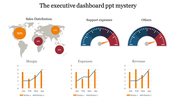
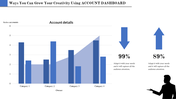
    You May Also Like These PowerPoint Templates

    Free
    Add to Wishlist
    Download
    AI Customize
    Executive dashboard slide featuring different vehicles like bike, car, container, train, and plane with title sections.
    Add to Wishlist
    Download
    AI Customize
    KPI dashboard featuring a funnel chart, audience metrics, bar graph, and a circular chart with 2021 data.
    Free
    Add to Wishlist
    Download
    AI Customize
    Executive dashboard template featuring six blue columns with titles and alternating light and dark blue text boxes.
    Add to Wishlist
    Download
    AI Customize
    KPI dashboard template with four gauges in blue, green, orange, and red, alongside a flowchart with colored boxes.
    Add to Wishlist
    Download
    AI Customize
    Colorful dashboard PPT template featuring financial figures, text placeholders, and a radar chart for visual data analysis.
    Free
    Add to Wishlist
    Download
    AI Customize
    Slide featuring a bar graph and line chart showing monthly money transactions, alongside silhouettes of people shaking hands.
    Add to Wishlist
    Download
    AI Customize
    Executive dashboard table featuring numbered rows, with text, and red column headers for clarity.
    Free
    Add to Wishlist
    Download
    AI Customize
    PowerPoint template featuring a colorful dashboard with bar graphs, pie charts, progress rings, and a timeline for data.
    Add to Wishlist
    Download
    AI Customize
    Dashboard showing expense meters, global percentages on a map, and a bar chart visualizing data distribution.
    Add to Wishlist
    Download
    AI Customize
    Slide deck with KPI charts and graphs for business analysis, including financials, HR performance, and customer service.
    Add to Wishlist
    Download
    AI Customize
    KPI dashboard template with a line chart, progress indicators, and bar graphs showing different performance metrics.
    Free
    Add to Wishlist
    Download
    AI Customize
    Free KPI PPT Template For Presentation & Google Slides
    Free
    Add to Wishlist
    Download
    AI Customize
    Dashboard layout includes a line graph, pie chart, and three bar graphs, all colored in red, green, and blue.
    Free
    Add to Wishlist
    Download
    AI Customize
    Project dashboard slide for electricity data with bar graphs showing units and amounts for different categories and months.
    Add to Wishlist
    Download
    AI Customize
    KPI dashboard template with progress bars, pie chart, bar graphs, and workload metrics in a clean blue theme.
    Add to Wishlist
    Download
    AI Customize
    Dashboard slide showing business performance, including technology, accessibility, and security scores with activity graphs.
    Add to Wishlist
    Download
    AI Customize
    KPI dashboard slide featuring six charts vertical bars, horizontal bars, area graph, pie chart, and column bar graphs.