Creative KPI Dashboard Template Presentation 

Dashboard showing expense meters, global percentages on a map, and a bar chart visualizing data distribution.
P.ID : 1789
    2.7K+ views
    189 Downloads
    Get Custom Slides by Experts
    Instantly Access Templates in PowerPoint

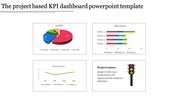
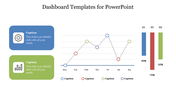
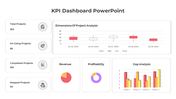
    Vibrant KPI Dashboard Presentation Slides


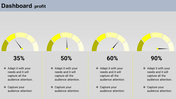
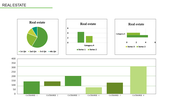
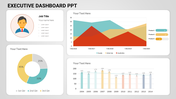
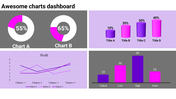
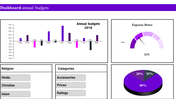
    Level up your data analysis with our KPI Dashboard Template. Our executive dashboard is designed to provide a comprehensive overview of key performance indicators in a visually appealing and informative manner. With three vibrant yellow layouts to choose from, you can effortlessly track your progress and make data-driven decisions. The inclusion of a world map and bar chart allows you to visualize global performance and identify areas for improvement. Upgrade your data visualization game and present your metrics with clarity and impact.


    Features of the template

    • 100% customizable slides and easy to download.
    • Slides are available in different nodes & colors.
    • The slide contains 16:9 and 4:3 formats.
    • Easy to change the slide colors quickly.
    • Well-crafted template with an instant download facility. 
    • Access on both MS PowerPoint and Google Slides.
    • World map outline added.
    • Bar chart infographics included.
    • Highly compatible with PowerPoint, Google Slides and Canva templates.
    Advertisement

    You May Also Like These PowerPoint Templates

    Add to Wishlist
    Download
    AI Customize
    Three colored tachometer gauges in red, orange, and green, each paired with a caption areas beneath.
    Add to Wishlist
    Download
    AI Customize
    Executive dashboard slide displaying project details including start date, deadline, team members, and activities.
    Add to Wishlist
    Download
    AI Customize
    Slide with three charts, each having four bars in green, pink, yellow, and blue, with text below.
    Add to Wishlist
    Download
    AI Customize
    KWL Chart Infographics PPT Template For Presentation
    Add to Wishlist
    Download
    AI Customize
    Yellow speedometer design with two semicircular gauges displaying percentages, each paired with captions.
    Free
    Add to Wishlist
    Download
    AI Customize
    Slide with a circular chart and two bars, highlighted in red, with progress indicator and explanatory text beside.
    Add to Wishlist
    Download
    AI Customize
    Tachometer PowerPoint template with four stages featuring colorful gauges and caption areas on a white backdrop.
    Add to Wishlist
    Download
    AI Customize
    Pie chart on the left with four colored sections and percentages, alongside steps with matching colors on the right.
    Add to Wishlist
    Download
    AI Customize
    PowerPoint slide with multiple charts and graphs, including a line chart, bar chart, and area chart, each with captions.
    Add to Wishlist
    Download
    AI Customize
    PPT slide with a line chart illustrating trends for three series, using red, blue, and yellow lines with a caption.
    Add to Wishlist
    Download
    AI Customize
    Technology slide featuring a line graph with data points and percentages, set against a grayscale geometric pattern.
    Add to Wishlist
    Download
    AI Customize
    Dashboard template with two horizontal bar charts, a calendar icon, and circular progress indicators in orange and green.
    Add to Wishlist
    Download
    AI Customize
    Two brown 3D pie charts side by side, showing company growth and achievement with segmented sections.
    Add to Wishlist
    Download
    AI Customize
    Project dashboard template with four speedometer charts representing different completion levels with placeholder text.
    Add to Wishlist
    Download
    AI Customize
    Infographic featuring two red semicircular speedometers with needles, displaying percentages, and captions below.
    Add to Wishlist
    Download
    AI Customize
    Chart slide featuring a weekly schedule with multiple rows and columns with placeholder text gradient blue and green bars.
    Add to Wishlist
    Download
    AI Customize
    Infographic with bar charts, percentage stats, and a layered blue 3D smartphone like structure with four captions.
    Free
    Add to Wishlist
    Download
    AI Customize
    Line chart with green and yellow lines showing three data series, text placeholders and a starburst badge.