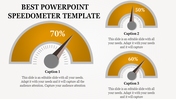
Best PowerPoint Speedometer Template for Presentation

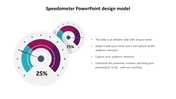
Speedometer PowerPoint Template and Google Slides
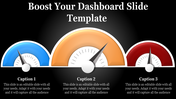
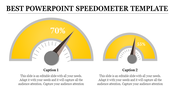
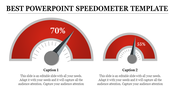
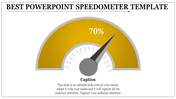
The Dual Speedometer Comparison Template offers a clear and engaging layout, perfect for anyone who wants to visually compare their performance against a target or another entity. This template features two distinct speedometers. The larger one represents your performance, while the smaller one represents a target, competitor, or another point of comparison. Each speedometer has a dedicated text area below it, allowing you to clearly label what each one signifies. The speedometers also display clear percentage values, providing an easy-to-understand visual representation of your progress.
The Dual Speedometer Comparison Template is a valuable tool for many professionals. Sales and marketing teams can use it to compare their sales growth against targets or competitor performance, visually represent market share, and showcase their progress toward achieving sales goals. Project managers and team leaders can benefit by using the template to track project progress against deadlines or milestones, compare team performance against benchmarks, and communicate project status in a visually engaging way.
Features of this template:
- 100 % customizable slides are easy to download.
- Slides are available in different nodes and colors.
- The slide was contained in 16:9 and 4:3 formats.
- It is easy to change the slide colors quickly.
- Well-crafted template with an instant download facility.
- The clear layout of this template will help you design a professional-looking presentation.
- The multi-color visuals on this slide will make your presentation eye-catching.


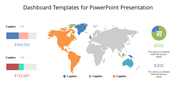
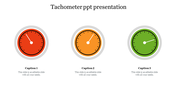
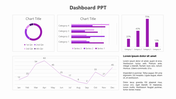
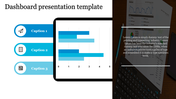
You May Also Like These PowerPoint Templates
Add to Wishlist
Download
AI Customize


Add to Wishlist
Download
AI Customize

Add to Wishlist
Download
AI Customize


Add to Wishlist
Download
AI Customize

Add to Wishlist
Download
AI Customize


Add to Wishlist
Download
AI Customize

Add to Wishlist
Download
AI Customize

Add to Wishlist
Download
AI Customize

Add to Wishlist
Download
AI Customize

Add to Wishlist
Download
AI Customize

Add to Wishlist
Download
AI Customize

Add to Wishlist
Download
AI Customize

Add to Wishlist
Download
AI Customize

Add to Wishlist
Download
AI Customize

Add to Wishlist
Download
AI Customize

Add to Wishlist
Download
AI Customize

Add to Wishlist
Download
AI Customize
