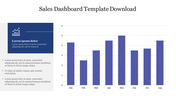
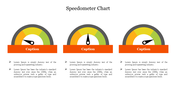
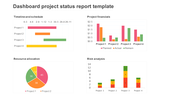
Amazing Dashboard PPT and Google Slides Themes

 Canva
Canva
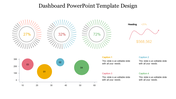
Dashboard PowerPoint Template
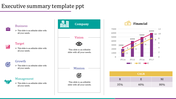
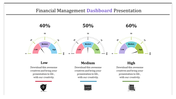
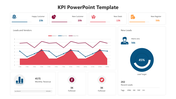
Brighten up your value-based presentations with our versatile Dashboard PowerPoint Template. The slide has five text boxes. Each of them provides valuable insights into business management and finance. Three boxes display money value icons relevant to financial analysis and business management. The two other boxes showcase percentage values and a world map.
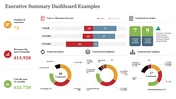
Suitable for financial analysts, business executives, project managers and consultants. It further offers a comprehensive overview of key metrics and indicators. An ideal template for presenting financial reports, analyzing market trends or monitoring project progress. Download now to offer a global perspective on financial performance.
Features of the template
- The slide contains 16:9 and 4:3 formats.
- Compatible with Google slide themes and PowerPoint.
- 100% customizable slides and easy to download.
- It is easy to change the colors of the slide quickly.
- Well-crafted template with an instant download facility.


You May Also Like These PowerPoint Templates

Add to Wishlist
Download
AI Customize

Add to Wishlist
Download
AI Customize


Add to Wishlist
Download
AI Customize

Add to Wishlist
Download
AI Customize

Add to Wishlist
Download
AI Customize

Add to Wishlist
Download
AI Customize

Add to Wishlist
Download
AI Customize

Add to Wishlist
Download
AI Customize

Add to Wishlist
Download
AI Customize

Add to Wishlist
Download
AI Customize

Add to Wishlist
Download
AI Customize


Add to Wishlist
Download
AI Customize

Add to Wishlist
Download
AI Customize


Add to Wishlist
Download
AI Customize

Add to Wishlist
Download
AI Customize

Add to Wishlist
Download
AI Customize
