Dashboard PPT Presentation Slide Templates

Three semi circle gauges in pastel colors, with percentage labels above, and related text and icons beneath.
P.ID : 5664
    1.3K+ views
    112 Downloads
    Get Custom Slides by Experts
    Instantly Access Templates in PowerPoint

    Dashboard  Presentation Template


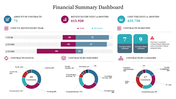
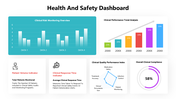
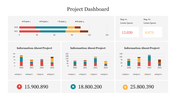
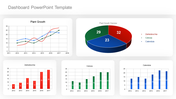
    Transform Your Finances: Introducing Our Dashboard Presentation Template. Imagine having a tool that simplifies your financial journey—a slide filled with graphs, charts, and dashboards to turn complex data into actionable insights. Our template does just that!

    In the next section, discover how this presentation makes tracking income, expenses, and cash flow a breeze. It's designed for everyone, from entrepreneurs to financial analysts, providing clarity and precision in decision-making. Take advantage of this chance to get any financial information, whether you're a startup streamlining resources or an established company fine-tuning approaches.

    Download the Dashboard Presentation template now and redefine your financial success. 

    Features of the Template


    •  100 % customizable slides.
    •  The slide show is in 4:3, 16:9, zip format.
    •  There is powerful connectivity with Google Slides and PowerPoint.
    •  It is simple and quick to alter the slide's color.
    •  An efficient template that can be easily accessed immediately.
    •  Well-crafted template with an instant download facility.
    Advertisement

    You May Also Like These PowerPoint Templates

    Add to Wishlist
    Download
    AI Customize
    Slide with two speedometer style gauge charts in green, red, and purple segments, displaying percentages.
    Add to Wishlist
    Download
    AI Customize
    Dashboard template with a world map showing highlighted regions, bar graphs, and financial data captions.
    Add to Wishlist
    Download
    AI Customize
    Three colored tachometer gauges in red, orange, and green, each paired with a caption areas beneath.
    Add to Wishlist
    Download
    AI Customize
    Yellow speedometer design with two semicircular gauges displaying percentages, each paired with captions.
    Add to Wishlist
    Download
    AI Customize
    Tachometer PowerPoint template with four stages featuring colorful gauges and caption areas on a white backdrop.
    Add to Wishlist
    Download
    AI Customize
    Dashboard slide showcasing a semi circular layout with five numbered segments in blue, red, and green, each with captions.
    Add to Wishlist
    Download
    AI Customize
    Project dashboard template with four speedometer charts representing different completion levels with placeholder text.
    Add to Wishlist
    Download
    AI Customize
    Infographic featuring two red semicircular speedometers with needles, displaying percentages, and captions below.
    Add to Wishlist
    Download
    AI Customize
    Purple themed dashboard slide featuring multiple charts and a text box for descriptive content.
    Add to Wishlist
    Download
    AI Customize
    Dashboard slide with three blue icons and captions paired with a bar chart on a tablet screen, and a desk setup on the right.
    Add to Wishlist
    Download
    AI Customize
    Yellow speedometer graphic indicating 70%, with a gray needle pointing right and a caption area below.
    Add to Wishlist
    Download
    AI Customize
    Black circular speedometer gauge with a green needle, surrounded by six captions on a white background.
    Free
    Add to Wishlist
    Download
    AI Customize
    Circular speedometer infographic with a black needle, yellow progress arc, and distance markers, next to an text box.
    Add to Wishlist
    Download
    AI Customize
    Sales performance dashboard PowerPoint template with a line graph, pie chart, and percentage change analysis.
    Add to Wishlist
    Download
    AI Customize
    Speedometer PowerPoint template with yellow background showing a 70 percent reading, along with 50 and 60 percent gauges.
    Add to Wishlist
    Download
    AI Customize
    Executive dashboard featuring a bar chart of project tasks, pie chart for project distribution, and a line graph.
    Free
    Add to Wishlist
    Download
    AI Customize
    Speedometer graphic with a blue progress bar, labeled distance values, and a right-side text box explaining its concept.