Editable Project Management KPI And Dashboard PowerPoint

Dashboard slide showcasing project management KPIs with bar graphs, a line graph, and a pie chart in different colors.
P.ID : 31547
    899 views
    80 Downloads
    Get Custom Slides by Experts
    Instantly Access Templates in PowerPoint

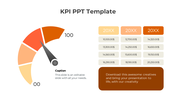
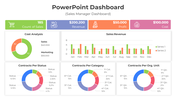
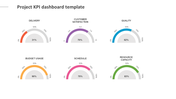
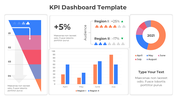
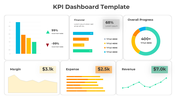
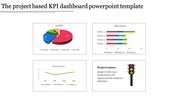
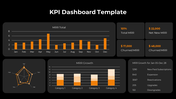
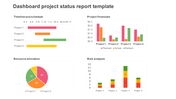
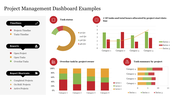
    Project Management and KPI Dashboard PowerPoint Slide


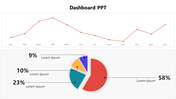
    Streamline your project management processes and track key performance indicators (KPIs) effortlessly with our project management and KPI dashboard PPT and Google Slides template. Designed to simplify complex project data and metrics, this template offers a comprehensive solution for project managers and teams. With a focus on providing helpful content, each slide is carefully crafted to guide you through project planning, execution, and monitoring phases. Whether you're analyzing project timelines, assessing resource allocation, or evaluating KPI performance, this template has you covered. With 100% editable and customizable elements, you have the freedom to adapt the content to meet your specific project needs. Take your project management to the next level and download this project management and KPI dashboard PPT template today. With its user-friendly features and professional design, this template empowers you to create impactful dashboards that drive project success.


    Features of the template


    • 100% customizable slides and easy to download.
    • The slide contains 16:9 and 4:3 formats.
    • Easy to change the colors of the slide quickly.
    • Highly compatible with PowerPoint and Google Slides.
    Advertisement

    You May Also Like These PowerPoint Templates

    Add to Wishlist
    Download
    AI Customize
    Colorful Tachometer slide with color coded sections from light to BMI with placeholder text.
    Add to Wishlist
    Download
    AI Customize
    Slide with three tachometer dials in blue, purple, and pink, each aligned above a matching caption box.
    Add to Wishlist
    Download
    AI Customize
    Dashboard graphics displaying vehicle speeds with a data table listing vehicles, brands, and status.
    Add to Wishlist
    Download
    AI Customize
    Project dashboard slides with Gantt chart, a burndown chart, and a timeline, using a palette of brown, green, and red.
    Add to Wishlist
    Download
    AI Customize
    Tachometer PowerPoint slide with gauges indicating 10, 20, and 30 with captions for each.
    Add to Wishlist
    Download
    AI Customize
    Concentric pentagons in black with text areas around each corner, forming a simple monochrome layout.
    Add to Wishlist
    Download
    AI Customize
    Horizontal infographic with four tachometer icons in gradient colors, labeled with captions for each gauge.
    Add to Wishlist
    Download
    AI Customize
    Slide featuring a tachometer dial with four performance levels and linked captions in red, yellow, maroon, and blue.
    Add to Wishlist
    Download
    AI Customize
    Dashboard layout with charts in orange tones, including a donut chart, bar graphs, and a line chart for monthly data.
    Add to Wishlist
    Download
    AI Customize
    Slide with four red speedometers, each indicating a different percentage level, against a white background.
    Add to Wishlist
    Download
    AI Customize
    Blue themed dashboard layout with a line chart, two growth metrics, and three semi circle gauges for budget.
    Free
    Add to Wishlist
    Download
    AI Customize
    Circular speedometer with orange and gray segments, displaying kilometer markings from 5.5 KM to 8 KM.
    Free
    Add to Wishlist
    Download
    AI Customize
    Dashboard graphic featuring a circular speedometer with a red needle, surrounded by text labels for various business metrics.
    Add to Wishlist
    Download
    AI Customize
    Speedometer slide with three colorful gauges showing percentages each with captions.