Elegant Dashboard PPT Presentation Templates 

Dashboard graphics displaying vehicle speeds with a data table listing vehicles, brands, and status.
P.ID : 1857
    378 views
    13 Downloads
    Get Custom Slides by Experts
    Instantly Access Templates in PowerPoint

    Elegant Dashboard PPT Presentation Templates 


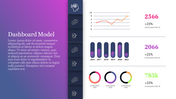
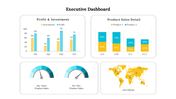
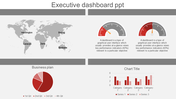
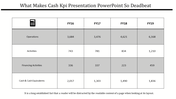
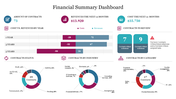
    Our Dynamic dashboard PowerPoint presentation templates can assist you in transforming intricate data into a visually compelling narrative that resonates with your audience. Our templates help you present complex information professionally and effectively, showcasing your data clearly and concisely for easy understanding. Say goodbye to boring and complicated spreadsheets and slides! Instead, enjoy clear, easy-to-understand, and visually impressive data presentations with a professional touch.


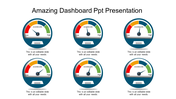
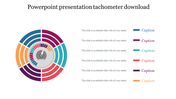
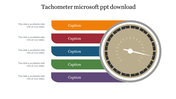
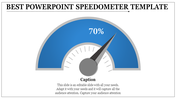
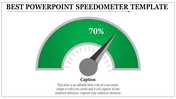
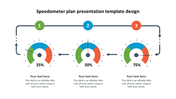
    With our service, you can personalize your vehicle's displays without any difficulty. We offer pre-made designs that make it easy to see how fast you're going with visuals like speedometers, gauges, and progress bars. You can change them to fit your needs. Our dashboard PPT templates suit everyone, whether you're a pro or a student. Create professional presentations in a matter of minutes, even if you don't have prior experience in data visualization. Our dashboard templates are tailored to cater to your professional needs and can help you communicate your goals with ease.


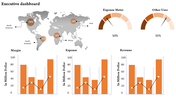
    By presenting your data clearly and concisely, you can help your audience understand insights, identify trends, and make informed decisions. With our templates, you can be assured that your presentations will be polished and effective and will help you achieve your desired outcomes. Ready to take your data presentations to the next level? Download our dashboard PowerPoint templates today and see the difference!


    Features of the template:


    • Slides are available in different sizes and colors.
    • Easy to change the slide colors.
    • Well-crafted template with instant download.
    Advertisement

    You May Also Like These PowerPoint Templates

    Add to Wishlist
    Download
    AI Customize
    Executive dashboard slide displaying many charts from new business to operational expenses.
    Add to Wishlist
    Download
    AI Customize
    Dashboard template with a semi-circular gauge indicating performance with a blurred image and caption areas.
    Add to Wishlist
    Download
    AI Customize
    Dashboard slide showing plant growth data with details table and area chart for Zantedeschia, Celosia, and Calendula.
    Add to Wishlist
    Download
    AI Customize
    Colorful Tachometer slide with color coded sections from light to BMI with placeholder text.
    Add to Wishlist
    Download
    AI Customize
    Slide with three tachometer dials in blue, purple, and pink, each aligned above a matching caption box.
    Add to Wishlist
    Download
    AI Customize
    Dashboard graphics displaying vehicle speeds with a data table listing vehicles, brands, and status.
    Free
    Add to Wishlist
    Download
    AI Customize
    Four vertical pointed icons in red, blue, purple, and orange, each aligned with caption on a light background.
    Add to Wishlist
    Download
    AI Customize
    Project dashboard slides with Gantt chart, a burndown chart, and a timeline, using a palette of brown, green, and red.
    Add to Wishlist
    Download
    AI Customize
    Tachometer PowerPoint slide with gauges indicating 10, 20, and 30 with captions for each.
    Add to Wishlist
    Download
    AI Customize
    Concentric pentagons in black with text areas around each corner, forming a simple monochrome layout.
    Add to Wishlist
    Download
    AI Customize
    Horizontal infographic with four tachometer icons in gradient colors, labeled with captions for each gauge.
    Add to Wishlist
    Download
    AI Customize
    Slide featuring a tachometer dial with four performance levels and linked captions in red, yellow, maroon, and blue.
    Add to Wishlist
    Download
    AI Customize
    Dashboard layout with charts in orange tones, including a donut chart, bar graphs, and a line chart for monthly data.
    Add to Wishlist
    Download
    AI Customize
    Slide with four red speedometers, each indicating a different percentage level, against a white background.
    Add to Wishlist
    Download
    AI Customize
    Key performance indicator slide displaying data bars, percentages, and distinct icons in a structured layout.