PPT Speedometer Template for Measuring Business Success

 Canva
Canva
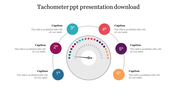
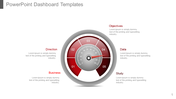


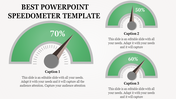
Speedometer PowerPoint Template and Google Slides
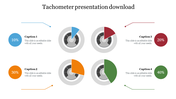
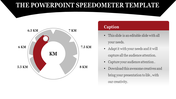
The "Speedometer PowerPoint Template and Google Slides" features an image of a speedometer, a gauge commonly used to measure speed. The speedometer includes a needle that indicates the speed, and it is divided into different sections, each representing a different speed range.
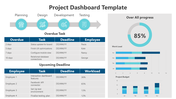
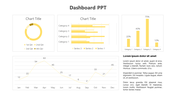
This template is ideal for presentations related to performance evaluation, goal tracking, or progress monitoring. It can be used to visualize metrics such as project milestones, sales targets, or key performance indicators (KPIs), allowing presenters to highlight achievements or areas needing improvement. Suitable for professionals in fields such as project management, sales, marketing, or performance analysis.
Compatible with both PowerPoint and Google Slides, ensuring flexibility in presentation creation and sharing. Available in "16:9" and "4:3" aspect ratios, as well as zip formats, for compatibility with various devices and platforms. This template is offered as a free download and is fully customizable. Download this template now and drive engagement with dynamic visuals!


You May Also Like These PowerPoint Templates
Add to Wishlist
Download
AI Customize

Add to Wishlist
Download
AI Customize

Add to Wishlist
Download
AI Customize

Add to Wishlist
Download
AI Customize

Add to Wishlist
Download
AI Customize

Add to Wishlist
Download
AI Customize

Add to Wishlist
Download
AI Customize

Add to Wishlist
Download
AI Customize


Add to Wishlist
Download
AI Customize

Add to Wishlist
Download
AI Customize

Add to Wishlist
Download
AI Customize

Add to Wishlist
Download
AI Customize

Add to Wishlist
Download
AI Customize

Add to Wishlist
Download
AI Customize

Free
Add to Wishlist
Download
AI Customize

Add to Wishlist
Download
AI Customize

Add to Wishlist
Download
AI Customize

Add to Wishlist
Download
AI Customize

Add to Wishlist
Download
AI Customize
